 0 comments have been left for this article.
 BP Comment Quick Links

|

|
April 25, 2007 The Big PictureIf You Win, They Will Come
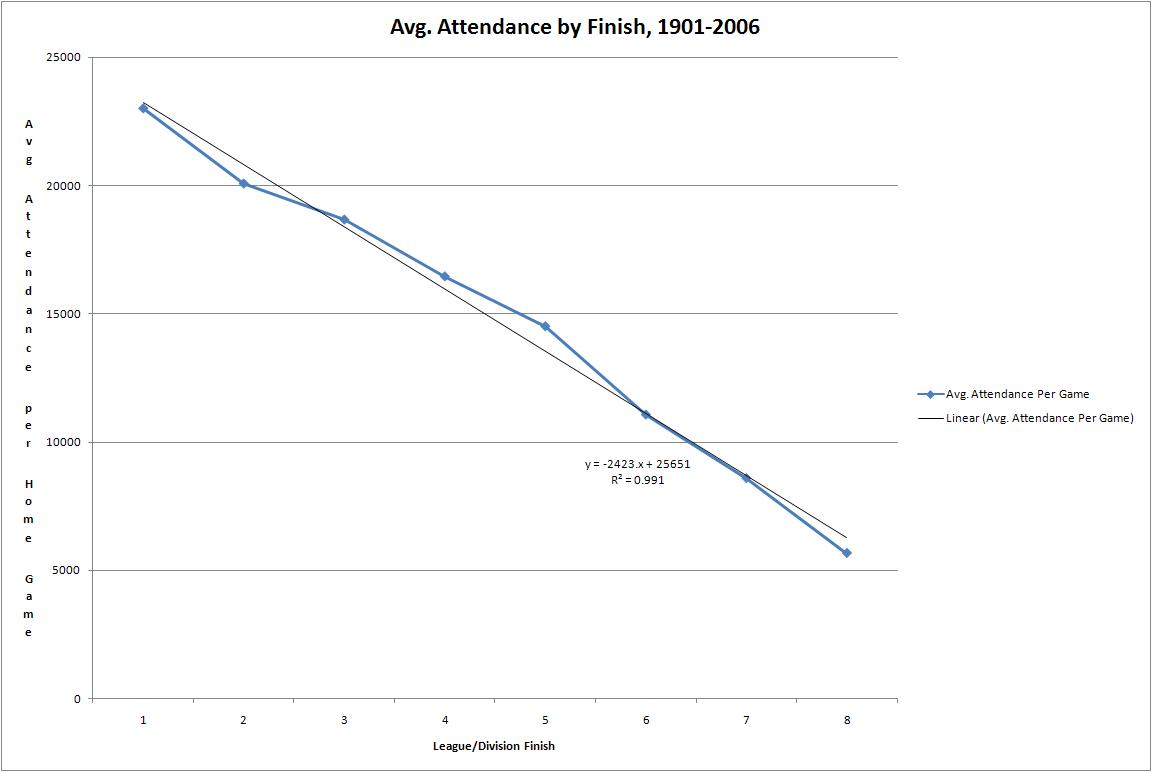
Our research so far tells us a change that took place around 1976 caused baseball to go into a thirty-year period of strong attendance growth. That was the year free agency took hold, changing the method of constructing ball clubs. So how did teams use free agency to increase their attendance? Answering that moves us from what happened to how it happened. "Nobody wants to watch a twelfth-place team." That quote provides the reasoning for splitting the leagues into divisions in 1969. From this, let's explore the hypothesis that winning affects attendance. The following table shows average attendance based on league or division finish (leagues and divisions were the same before 1969; ninth- and tenth-place clubs were not included since their existence covers a very small period of time in major league baseball). Click on the graph for a larger image:
That's a very strong relationship between a team's final standing and the fans they attract. On average, one place lower in the standings cost a team 2,400 fans per game. That's 200,000 tickets in a year, and all the hot dogs, sodas, and beers that go with that. This represents a huge incentive for teams to improve so they can move up in the standings. The percentage change in attendance from the previous season represents another way to relate winning with ticket buyers. The following table displays for each division rank the average percentage change from the previous year (100 * (year - previous)/previous) for average attendance per home game, as well as the standard deviation.
Percentage Change in Attendance from the Previous Year
Rank    Avg. Percentage Change        Standard Dev.
   1                      17.6%          34.7
   2                      14.0           41.3
   3                       8.3           28.5
   4                       3.3           29.3
   5                       3.4           39.9
   6                       2.0           41.9
   7                      -0.01          37.3
   8                      -7.8           25.3

Avg. change
for all teams              6.6%
Once again, building a winner builds attendance. Teams grew on average 6.6 percent per year, but if you want to stay ahead of the game you need at least a third-place team. Please take note of the large standard deviations as well--it's not unusual for a first-place team to lose attendance, but attendance going up remains a good bet for a high-ranking club. The above table also shows that the idea quoted earlier is basically true. It can probably be reformulated as, "Nobody wants to see a last-place club." Even seventh-place teams mostly hold their attendance from year to year. One other relationship that piqued my curiosity was the carry-over effect. Does a first-place finish help increase attendance the next season? Does the prospect of a repeat bring out the fans? Does the prospect of another dismal finish keep fans at home? Here's a similar table, but it looks at the percentage change from the finish year to the next year (100*(next - year)/year). The result surprised me:
Percentage Change in Attendance to the Next Year
Rank    Avg. Percentage Change        Standard Dev.
   1                      -2.1%          18.5
   2                       0.58          24.2
   3                       1.9           29.0
   4                       3.1           29.2
   5                       7.7           38.7
   6                      13.7           38.2
   7                      18.4           57.9
   8                      25.3           53.3
A team's finish one year and the change in attendance the next season shows an inverse relationship! Both the percentage change column and Standard deviation column contain useful information here. First, the percentage change sure looks like regression to the mean at work on team winning percentages--Bill James called it the law of competitive balance. Good teams tend to see their winning percentages and place in the standings decline the next season, while poor teams tend to make moves that improve their winning percentage and place in the standings. We see bad teams getting better and bringing in more fans, and good teams losing both ground and attendance. The standard deviation column, however, shows that the good teams tend to hold onto their gains. The better a team plays one year, the less volatility in attendance the next. While lower-finishing teams can see big jumps the next year, they can also see large declines as well. The huge swings are less frequent with clubs that finish first or second. Once again, change is good, and finishing first is good for business. It increases attendance the year the team does well, and teams tend to keep those gains into the next year. Moving up from a low perch is good for business, mostly due to starting at a lower level. It follows that a large number of different teams finishing first from year to year should be good for baseball attendance.
Number of Different First-Place Franchises by Decade
Decade          Number of Unique First-Place Teams
  1900               7
  1910              10
  1920               7
  1930               8
  1940              10
  1950               7
  1960              12
  1970              14
  1980              21
  1990              21
  2000              16
Baseball took measures in the mid-Sixties to increase volatility in the game. The introduction of an amateur draft broke the Yankees' stranglehold on first place in the American League, and the move to division play created four first-place finishes in every year instead of two. But notice not much changed between the 1960s and 1970s despite more teams and more divisions. The amateur draft simply moved domination from teams that bought the best players to teams that drafted the best players. The two moves were a step in the right direction, but not quite enough. Look at the jump in the 1980s, however. The leagues looked the same in the two decades, but unique first-place teams jumped 50 percent compared to the 1970s. The big difference? Free agency. Teams could no longer control players forever, which made long-term domination more difficult. A poor franchise could turn around quickly with the right purchases. That volatility carried over--more divisions in the 1990s helped make up for domination by the Braves and the Yankees. In this era teams finally went from worst to first. We're in an era where the fortunes of teams change quickly, and that keeps fans interested. In summation, fans like to attend games where they get to see winning teams. Good finishes tend to lead to large attendance increases, which tend to be held the following year. Poor finishes one season don't help attendance, but due to the law of competitive balance, tend to push it up next season. The amateur draft, division play, and free agency worked together to increase the volatility of team finishes, leading to the strong growth in attendance seen in the last thirty years.
|