
 8 comments have been left for this article.
 BP Comment Quick Links

|

|
August 31, 2017 Flu-Like SymptomsHow Designated Hitters Lost Their Groove (Part 2)Earlier this week, I used a lot of colorful graphs to illustrate how designated hitters, on the whole, are on track to finish 2017 with the worst offensive production (as measured by TAv) since the DH rule was adopted in 1973. And that’s not a one-off; the second-worst TAv by DHs was in 2010. The years 2004 and 2016 are tied for the seventh-worst, 2009 is the 11th-worst, and 2008 and 2013 are tied for the 17th-worst. The 21st century has not been kind to DHs. We’re not the only sabermetrically inclined website to highlight the DH this week. At the Hardball Times, Eli Ben-Porat also used a lot of colorful graphs to make a case for keeping the DH on Monday and eliminating it on Tuesday. As promised at the end of my Monday article, today I’d like to explore why DHs have become less accomplished hitters. The first thing that came to mind for me (and some people on Twitter) is that maybe the full-time DH has fallen out of favor. With David Ortiz retired, are there any dedicated DHs left? Well, yeah, there are. To check, I calculated to total plate appearances by the top DHs in the American League for every year since 1973. I defined top DHs as the n designated hitters with the most plate appearances in the league, where n is equal to the number of teams in the league. So my top DHs are the 12 with the most plate appearances for 1973-1976, the 14 with most from 1977-2012, and the 15 with most from 2013-2017. Here are the results:
There’s no evidence of a big change there. Generally speaking, the most frequently used DHs, measured by plate appearances, have accounted for 50-65 percent of all DH plate appearances since the rule’s inception. Recent years are within that trend. But 50-65 percent isn’t an overwhelming proportion. What are those top DHs doing when they’re not playing? Are they all like Ortiz, who last year had 613 plate appearances as a DH and didn’t play in the field at all? To answer this, I decided to use 1998 as my reference point. As I pointed out in my article Monday, that was the year that American League DHs recorded their highest TAv ever, .283. Here are the top dozen DHs in 1998, measured by plate appearances. For each player, I’ll also list the other positions they played that season, measured by innings. (And yes, I excluded innings in the field in interleague games during which the DH was not in effect.)
The 12 most frequently used DHs in 1998 had 5,314 plate appearances. When not in the lineup as DH, they also played 1,870 innings in the field, all of them at first base, left field, or right field. That works out to an average of 17 nine-inning games per player. In other words, when the most frequently used DHs were not DH-ing, they were mostly sitting on the bench. Here’s the same table for last season, when Ortiz didn’t play in the field at all:
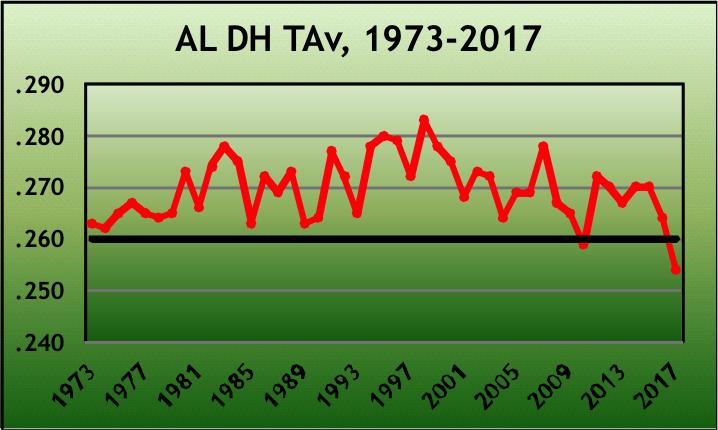
The 12 most frequently used DHs last year had five percent fewer plate appearances than their 1998 counterparts. But they played 72 percent more innings in the field. Five of the 12 played at least 400 innings on defense last year; only Jose Canseco met that threshold in 1998. (Insert joke about Jose Canseco on defense here.) There’s a demand on DHs to have versatility now. On average, the most frequently used DHs in 2016 played 30 games in the field when not serving as DH. And this year? There have been 18 players with at least 100 plate appearances at DH. Of them, eight have accumulated at least 45 percent of their plate appearances somewhere other than at DH, including the leading DHs for Minnesota (Robbie Grossman), Oakland (Ryon Healy), Tampa Bay (Corey Dickerson), and Texas (Shin-Soo Choo). In 1998, of the 18 most frequently used DHs, only five were similarly versatile. In my last article, I referred to Bill James’ defensive spectrum, and I’m going to again. DHs are at the far left side of the spectrum, because they require no defensive skill. As one moves right—to first basemen, then left fielders, then right fielders, third basemen, center fielders, second basemen, shortstops, and catchers—the number of players capable of playing the position declines, due to defensive demands, and hitting becomes a smaller component of the player’s value. A good-fielding catcher who hits .240 has a job in the majors. A good-fielding left fielder who hits .240 rides busses at Double-A. So as American League teams demand that their DHs play the field, they are, by definition, sacrificing offensive performance for defensive flexibility. And why the emphasis on defensive flexibility? Pitchers. Not pitchers, as in the way they throw. It’s pitchers, as in their sheer numbers. If you type m.mlb.com/xxx/roster into your browser, where xxx is a team’s two- or three-letter abbreviation (like BAL, MIN, OAK), you’ll get the team’s 25-man roster. They change all the time, but odds are you’ll find 13 pitchers. That means there are 12 remaining roster spots. Eight are taken by the primary position players, and every team needs a backup catcher and a utility infielder. That leaves just two players. If one’s a full-time DH who doesn’t play the field, the AL team’s bench will have just three players who can take the field, two of whom you’d like to keep on reserve in case of injury. A DH who can also play a position gives his manager more opportunities to make substitutions, give players a rest, and optimize defense and offense. But it comes at an offensive cost, and we’ve seen that cost erode DH offensive performance. It’s not that DHs are getting worse, it’s that gigantic pitching staffs are crowding them out. A huge pitching staff can’t squeeze out the team’s catcher, or shortstop, or center fielder. But it can force a change in DH strategy. Now, a big caveat is in order here. Here’s the graph that I had in my article Monday, displaying TAv by DHs since 1973, updated through games of August 29.
As you can see, it hasn’t been a smooth ride. It sure looks as if DH performance is on the way down. But we might’ve said the same thing in 1985, when the TAv by DHs fell from .278 to .263 in two seasons, or in 1993, when it declined 12 points in two years. The reason for this year’s below-average performance could be that the demands of positional flexibility are eroding DH hitting. Or it could just be a reflection of several DHs having bad years: Pujols, Morales, Martinez, Hanley Ramirez, Mark Trumbo, Beltran, Matt Holliday, Brandon Moss, and Healy each have over 250 plate appearances at DH and below-average TAvs. So we don’t know for sure yet that we’re in a secular decline in DH production. But it sure looks like it, and if we are, it’s because pitchers, like an invasive species, are destroying their habitat on the bench.
Rob Mains is an author of Baseball Prospectus. Follow @Cran_Boy
|
A 15 point slide in TAv implies a large move across the defensive spectrum. The increased defensive flexibility in DHs that we've seen is pretty modest. In fact, I don't know that the defensive abilities of DHs have changed that much since 1998. It's just that with 13 pitchers the DHs HAVE to play the field more.