


 8 comments have been left for this article.
 BP Comment Quick Links

|

|
August 9, 2017 Baseball TherapyThe Case of the Missing FiremanWhat if Goose Gossage showed up at a team’s spring training camp. Not the 66-year-old, still fabulously mustachioed version of Goose Gossage. Imagine if Gossage stepped out of a time machine from, oh, let’s just say 1978, and reported with the rest of the pitchers and catchers on a February day. The Gossage who was quite happy to work multiple innings to pick up a save. And he was pretty good at it. He is, after all, in the Hall of Fame. Let’s for a moment mute the arguments about whether he should be in The Hall and whether WAR properly captures his value. Let’s also mute Gossage’s own well-publicized views on whether he should be in The Hall and whether WAR properly captures his value. He was really good at being a relief pitcher, but he filled a role that doesn’t really exist anymore. Gossage was a prototypical “fireman.” And he was one of the best. Whatever else one thinks of the “fireman” role, there's no question that the ability to pitch multiple innings of non-embarrassing relief is a very valuable skill to have in a bullpen. Why is it then that if Gossage were plunked into the middle of a current team’s camp, he wouldn’t be allowed to do the thing that he was undeniably good at? There aren’t any more firemen in MLB. I have a hard time believing that it’s because there aren’t pitchers who could do it. I think that MLB has simply foreclosed on the role itself. Today’s Goose Gossage would likely either be stretched out as a starter or put into a one-inning relief role. It seems a strange misuse of his talents. If a pitcher can both pitch well enough to handle high-leverage moments and can pick up both the eighth and ninth innings, then why not let him? Where are the missing firemen? It makes very little sense to take a job that could be done while only sacrificing one roster spot and make two pitchers do it. According to legend, we are supposed to blame Tony La Russa and Dennis Eckersley, as Eckersley became the prototypical one-inning closer and La Russa designed a bullpen around the one-inning reliever model in Oakland. Your honor, I think Tony La Russa was framed for this kidnapping. Warning! Gory Mathematical Details Ahead! First, let’s lament the graph that shows the downfall of the fireman closer. The graph shows the average number of outs recorded by pitchers who were awarded a save in a game. We see that in the 1950s and 1960s, the average save consisted of a pitcher getting about five outs. Today, the number is barely above three, and the bottom seems to have dropped out in the late 1980s, consistent with the emergence of Eck and the copycats that followed him.
Small leads in the late innings are now usually handled by multiple hands, rather than one fireman, but as has been pointed out before, teams aren’t actually getting better results than they used to in protecting those leads. This is a graph of all “save-worthy” (i.e., three runs or fewer) leads that teams were able to preserve in the seventh inning. (In these cases, the team entered the inning with the lead and emerged from that inning with the lead intact.)
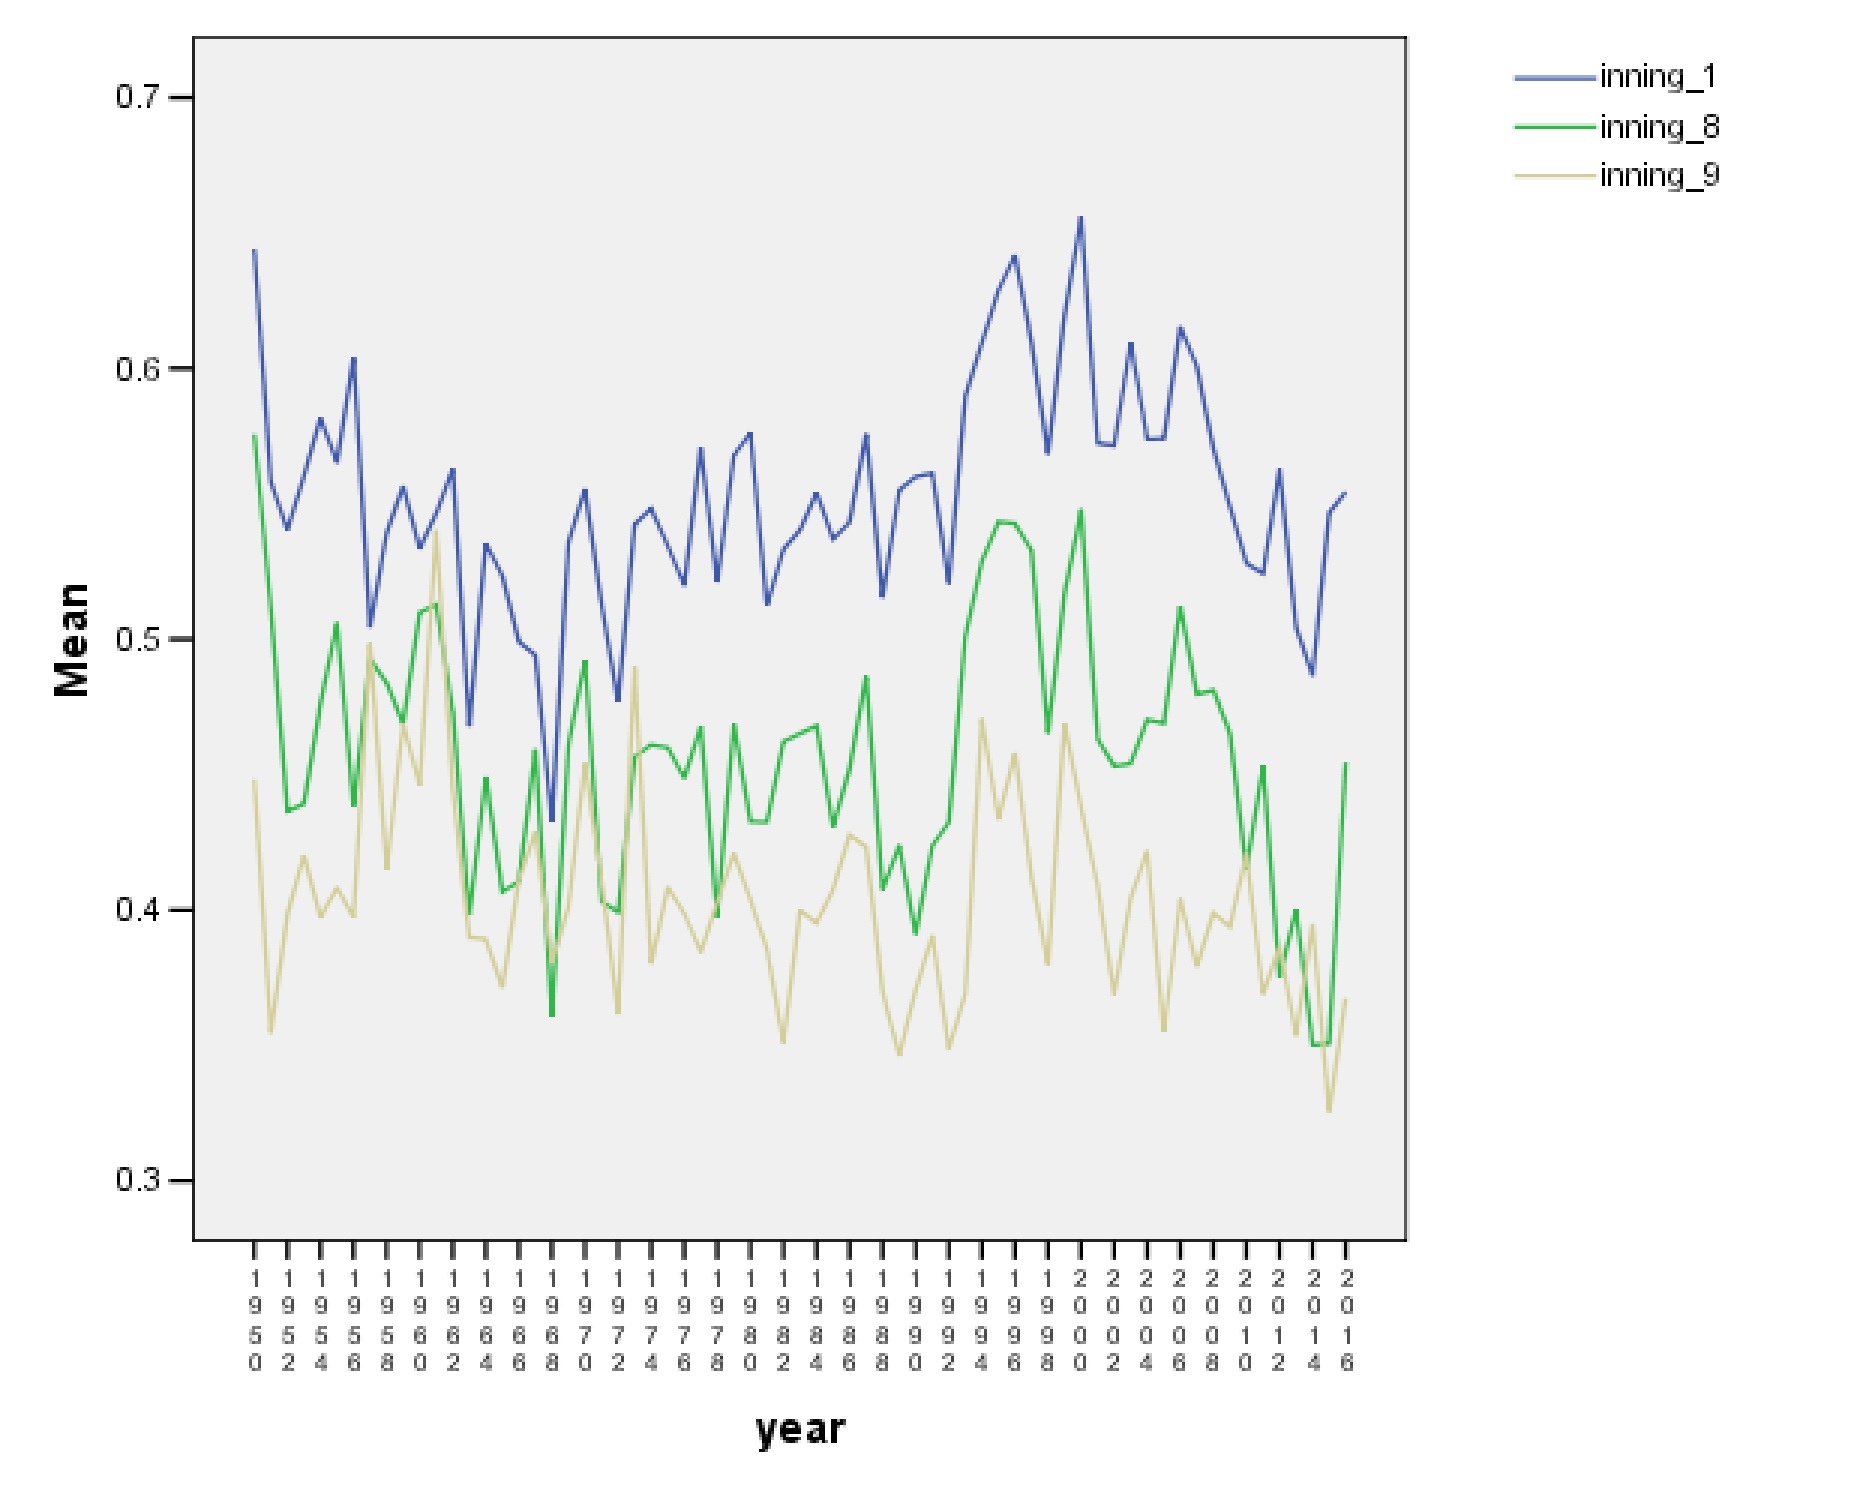
That graph is a little noisy, but we’re not seeing the shift from a two-inning closer to a one-inning closer making much difference in whether teams actually protected their leads. There was an uptick in lead protection, especially in the eighth inning, but that happened within the last decade, well after the shift from the fireman closer to the one-inning closer. I want to be careful making that claim, though. The shift to the one-inning closer model happened right before the 1990s, when offense went berserk. It’s possible that there was a positive effect from the one-inning closer model, but there was a countervailing force from the increased offense in the atmosphere which made holding any sort of small lead a lot harder to do. To check this, I present to you a graph with three lines. The top line is runs per inning in all first innings within that season. This gives us a baseline from which to work. The other two lines are the average runs per inning in eighth- and ninth-inning situations in which the pitching team entered with a save-worthy lead.
The graph above turns out to be a pretty interesting one. It shows that in the early part of our timeframe (the 1950s and 1960s), the number of runs given up in late-inning, high-leverage situations ran a lot more closely together with the RA rate for starters in the first inning, until the two groups got some separation in the early 1970s. But the odd thing is that the separation between those two lines didn’t get wider as baseball experimented with the fireman and then the one-inning closer. Below is the difference between the first-inning line and the eighth-inning/high-leverage situation RA lines. (The first-ninth inning graph shows the same pattern.)
Teams generally give up fewer late-game/high-leverage situation runs than they do in the first inning, but the magnitude of that difference hasn’t really changed much through either the fireman era or the one-inning reliever era. Teams haven’t really gotten better results through changing their strategy.
***
I think we need to back up for a moment. Below is another graph that shows that things may have started changing before we think they did. This is strikeout percentage (K/PA) for starters versus relievers. Again, we see that relievers and starters were tracking each other fairly closely until the early 1970s, when we begin to see some separation.
I’d argue that this is the result of another development in baseball that had been building up until the 1970s, which is the development of the relief specialist. By that, I mean baseball began to see more and more pitchers who were exclusively assigned to be relievers, and not just starters. Here’s a graph of all pitchers within a year who pitched at least 70 innings in relief. Some of them were swingmen/long relievers who also picked up a few starts here and there. Some were exclusively relievers. But watch the proportion change over time.
There’s a major drop from 1950s into the late 1960s, and it tails off further to the present day. But it’s worth noting that in the 1950s and 1960s, relievers were often called on to make starts on a consistent basis. During that time, we see that pitchers throwing in relief seem to get results consistent with starters. It seems that the late 1960s and early 1970s was the real birth of the “relief pitcher” as its own species. There had always been pitchers who had come into relieve the starter, but now the wall between the two groups had grown a little thicker.
The data shows very clearly that there have been two eras in high-leverage reliever usage. The graph below shows the evolution of how long a reliever remained in the game (measured by the number of outs he recorded) in games that he entered in the seventh, eighth, or ninth innings, and where his team held a “save-worthy” lead when he entered.
The standard story that we’ve been told is that this was a conscious decision to favor short-duration, max-effort outings. This had the twin benefits of allowing the relievers to throw really hard, but also to come back the next night, if needed, because throwing one inning didn’t build up as much of a pitch count. We’ve seen earlier in this article that the results that teams got overall weren’t necessarily better, but perhaps the idea of using Eckersley on back-to-back nights was more appealing than using Gossage for 2 1/3 innings and not having him available for a day or two. The evidence tells a different story. Here’s a graph, separated out by decades, that shows the average number of days that a reliever “rested” after an appearance in which he recorded X outs. (I censored all values above 10, because that probably means that he got sent to the minors or designated for assignment or something like that.)
The immediate way to interpret this graph is to note that beginning either in the 1980s or 1990s, teams began looking at relief outings in two separate categories. There were outings that lasted three or fewer outs, and then there were multi-inning outings. If a pitcher had gone into a second frame, he was given more rest. In the 1950s through the 1970s, the line for rest is fairly flat. A relief outing was a relief outing. There seemed to be a set number of days that one rested after such an outing. I think that’s the wrong way to interpret the above graph. Let me draw your attention to the fact that in the 1950s, we see that no matter how long a reliever went (up to the three-inning mark, anyway), he got about 3.6 days off until his next appearance. In the 1960s and 1970s, that dropped to 3.4 or so, but it was still a flat line. I’d submit that the 1950s through 1970s are the oddity here. Consider for a moment: Why is it that a pitcher who was soooooooo much tougher back during the “good old days” needed three or four days to “recover” from an outing where he only got an out or two? Why are today’s pitchers able to get back on the mound in two or three days? The “recovery” time for pitchers who pitch into a second frame in the 2000s and 2010s is in line with historical norms. What’s really happening is that modern-day pitchers are coming back much more quickly after a short outing. (Well, that’s a little deceptive. We’ll talk about why in a minute.) The evidence also shows that the idea of modern pitchers as not able to be shut down by multiple outings isn’t really true. Here’s a graph showing all appearances in which a reliever entered the game in the seventh, eighth, or ninth innings, with his team holding a save-worthy lead. He pitched and recorded at least four outs. The graph shows the percentage of time that pitcher came back to pitch on the next calendar day (or in the event of a doubleheader, later that day).
We see that it was never very common for a pitcher to do a multi-inning job and then come back the next night. Rates of this sort of re-appearance have declined over the past few years, but note that the outlier seems to be a local maximum that just happens to coincide with the fireman’s cultural heyday. If we look at how often that same group of pitchers came back within the next two days, we see that today’s pitchers are no more or less able to handle coming back after a longer outing.
Before we go any further on that line of argument, there’s something important that we need to say. Just because a pitcher didn’t pitch in a game, it doesn’t mean that he wasn’t available. It might mean that he wasn’t needed. Keep that in mind as we go forward.
***
I think I know who really kidnapped the fireman. We see that modern-day pitchers appear to be physically able to handle the role, and that the one-inning closer model isn’t any better or worse than the fireman model in terms of protecting leads. I’ve speculated before that maybe the problem is that even an elite reliever gets a little worse in his second inning of work, and there may simply come a point at which there’s another, better arm in the bullpen to take his place. But surely there have got to be teams, or at least days, when a two-inning save makes sense. And if you have a pitcher who can do that, why not let him? Why has the idea of the fireman disappeared so completely from the game? To answer that, I’d like to present two more graphs. One is the percentage of MLB starts in which the pitcher recorded 27 outs.
We know that the complete game is an endangered species and that rates of game completion have been slowly sliding downward for decades. Part of that is the fact that relievers have gotten better, but part of it seems cultural. This graph shows all situations in which the pitching team was entering the ninth inning with a save-worthy lead, and the percentage of the time that it was the starter who was on the hill.
Up until the mid-1970s, half the time that there was a situation that would now call for the closer, the starter was still out there! Rates were, of course, higher in the eighth and seventh innings. Now, it’s very rare. It might be that teams are now a little more wary of what high-pitch count games can do to a pitcher’s arm, but whatever the reasons, the question in the 1970s was not who would close out the game, but whether there would be a reliever in the game at all. Now consider for a moment what that means for a manager’s bullpen strategy. If he faces a situation in the seventh inning that might call for a fireman, he could put that guy in for an eight-out save. In any era, it probably means burning him for a day or two. But when you live in an era where tomorrow, you have a reasonable expectation that your starter will go nine innings—so you aren’t as likely to need warm bodies to fill innings and you're used to having your starter essentially act as his own fireman—it’s not a big deal to let a guy go for eight outs. The reality was that the demand for reliever workload in general was less than it is today. But over time, as complete-game rates started to fall, relievers became more specialized and managers started to feel less comfortable riding their starters with small leads in the late innings, the fireman model didn’t make as much sense. By the 1990s, a manager faced much less certainty that his pitcher would throw nine innings the next day. That means that he wasn’t going to farm out the fireman’s job to the starter the next day. It also means that a manager had to think about the distinct possibility of having to fill two or three innings tomorrow. He also has to think about the fact that tomorrow might be a close game. So, if a manager uses his really good reliever now for two innings, it might lead him to be hung out to dry for the next couple of days if a close game should come along. The one-inning model represented a way to hedge that risk. A manager might not be able to have his ace reliever go two innings in this game, but tomorrow he could probably still come back. In fact, with the near extinction of the complete game, the short-burst model allowed a manager to think of his relievers as tactical weapons, useful for specific, short-range purposes (LOOGY, ROOGY, setup guy, mop-up guy, closer), and using them in shorter bursts meant that whatever situation the game presented the next day, he would always have his full complement of relievers (or at least close to it) from which to choose. It was a compromise that fit the new realities of how starters were pitching. Tony La Russa just hit on a model that actually worked.
Russell A. Carleton is an author of Baseball Prospectus. Follow @pizzacutter4
|
IMO it's always the money. Yes I think the driving factor is the extinction of the complete game starter. That creates a need for specialized pure relievers. But once you have the pure relievers, then its cheaper to concentrate all the saves on one of them. Those saves cost money in arbitration. Whether they should or not is a different question - but they do cost money and the first handful of saves (saves 1-10) costs more per save than the last handful (saves 40-50). And the only way to concentrate the saves on one arbitree is to have them max out their appearances over the season by limiting them to the ninth and having them scarf up all the opps. Once the high-paid one-IP pampered closer is the BSD in the bullpen, its harder to get the lower-paid guys to do more pitching work (more IP over the course of the season) for less pay. Basically a seriously rigid hierarchy - almost a medieval guild - is created.
It doesn't even need to be a consequence of design. Maybe it just happened. But once it did happen, then any team that wants to change that and do something different is gonna have to do so by spreading money around the bullpen rather than by concentrating money on the closer. And when money is involved, don't hold your breath waiting.