


 14 comments have been left for this article.
 BP Comment Quick Links

|

|
April 20, 2017 Flu-Like SymptomsWearing One
I’m going to show you a lot of charts in this post. So if you don’t like charts, read one of the other articles on the site today. They’re good! I’m going to start out by showing you a chart and ask you to guess what it is. The x axis is the years from 1920 to 2016. The y axis is a familiar baseball metric. It’s not something obscure like my article on Monday about multiple blown saves. Here it is:
OK, something that’s gone down sharply since 1920. Sacrifice bunts per team? Plate appearances ending with a ball in play? Games completed in less than three hours? Nope. It’s this:
That makes sense. Complete games are a rare event now. But it’s not just pitchers lasting nine innings.
Starting pitchers who last at least eight innings, but fewer than nine, are in decline as well. Again, that makes sense. Starters are giving way earlier to a parade of hard-throwing relievers. Same downward slope as above. But the chart shape is going to start changing ... now.
Obviously, the increase in starters pitching at least seven but fewer than eight innings isn’t a reflection of contemporary pitchers throwing more innings. It’s that they’re pitching fewer. When nearly three-fifths of starters were staying in the game at least eight innings, there just weren’t a lot of shorter outings to go around. Seven is the new eight.
The chart for pitchers lasting at least six innings but fewer than seven is much more stark. That used to happen in about one out of every 12 starts. Now it’s pushing one in three. In contemporary baseball, starts of this length represent the plurality.
Same story with pitchers lasting at least five but fewer than six innings. A century ago, most starters lasted at least eight innings. Now, most last through five, six, or seven.
Even starts of at least four innings but fewer than five are up. Starters are going shorter and shorter.
The trend seems to be slowing here, though. The percentage of starters who throw at least three innings but fewer than four have held more or less steady through the years. At this point, I should make an apology to chart aficionados. I keep changing the y axis scale. I think the reason should be clear: If I’d kept the 0 percent to 50 percent range from the first chart, you wouldn’t be able to discern much of anything here. And I’m going to continue playing with the scale, so you can see what’s going on. Let’s move on to super-short starts, lasting fewer than three innings.
Hmm. That’s a mostly downward trend. Starters are less likely to last at least two and fewer than three innings than they were through the 1960s.
If you ignore the scale of this graph and just look at the shape, it looks a lot like the earlier graph of pitchers who lasted at least eight but fewer than nine innings. A starter pitching at least one inning but fewer than two has become much less common.
And this is like the nine-plus innings graph—almost never happens anymore. Granted, it’s falling from a much lower level, but it’s fallen nonetheless. Let me summarize for you, then I’ll knock it off with all the graphs.
Through the end of World War II, most starting pitchers lasted at least eight innings. That proportion’s been 10 percent or lower for 11 straight years, culminating with an all-time low of 5.5 percent last season. Long outings have become rare.
Taking the place of outings lasting at least eight innings, pitchers’ starts lasting at least three innings but fewer than eight are now dominant. In 2016, 90 percent of starts fell in this range.
Very short outings of fewer than three innings are down, though. This is a surprise, isn’t it? We all know pitchers don’t go nine, or even eight, innings much anymore. And we know that most starts are shorter. But if seven-, six-, five-, and four-inning starts are more common, why aren’t starts of fewer than three innings? The easiest answer would be that there aren’t as many horrible outings that force the manager to hand over six or more innings to the bullpen. Take the high-water mark for pitchers lasting three or fewer innings, 1948, when nearly 14 percent of starts were like that. Here are the cumulative statistics for starters pulled before the third innings, both raw statistics and the percentage of league average, in 1948:
Yeah, an ERA of 21.14 and a .491/.582/.735 slash line, those are pretty awful. There were 342 outings that season than ended before the third inning was over. It looks as if they deserved to end then. The proportion of starts that ended before three innings in 2014 was 2.6 percent, the lowest in this analysis, less than a fifth of 1948’s rate. Let’s see whether this is, in fact, because they’re not as awful as they used to be. This is a little bit of an everybody-who’s-not-here-raise-your-hand problem, since we don’t know about the pitchers who pitched poorly in the early innings but didn’t get pulled. But if the threshold of awfulness hasn’t changed, and fewer pitchers are getting pulled now, it follows that there are fewer pitchers reaching the threshold. Here are the numbers:
Okay, scratch most of that last paragraph. Pitchers who got pulled early in 2014 were a lot worse than they were in 1948, both absolutely and relatively. In 1948, their ERA and RA9 were just over five times the league average. In 2014, they were nearly six times the average. Pitchers who left before the third allowed an OPS just over 1.8 times the league average in 1948; in 2014, that figure was nearly 2.1 times. And I want to just type a .510/.589/.848 slash line for the fun of it. So to summarize: Starting pitchers who last three or fewer innings are much less frequent now than they were in the past. They are also much worse than they were in the past. In 1948, they wound up being charged with an average of 4.0 runs per start. In 2014, it was 4.9. Again, why? Why are managers today so much more reluctant to pull struggling pitchers early? OK, I lied. One more graph, which answers the question:
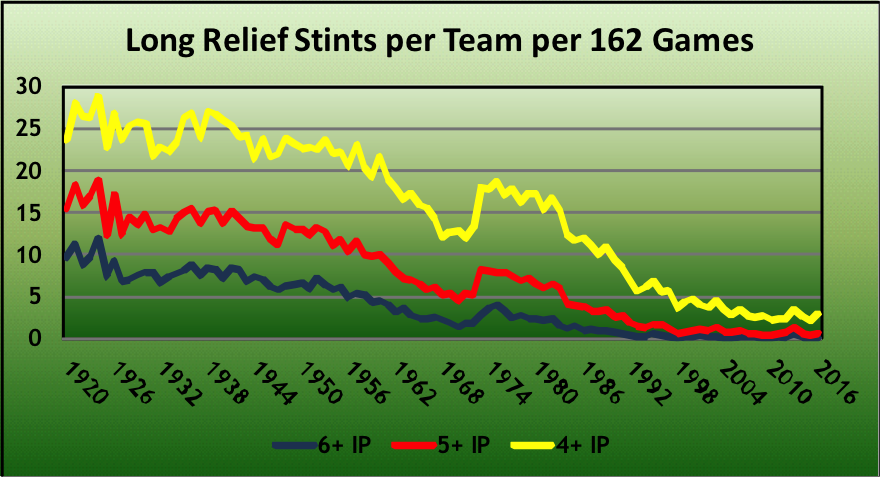
It’s not just starters who don’t go long anymore. Relievers don’t either. With the average relief appearance hovering around one inning, it’s really hard for a team to cobble together enough relievers to replace a pitcher in the first few innings. In 1924, the average team, playing a 154-game season, had 11 relief appearances of six or more innings. The last time there were that many in total in the majors was 1996 (when there were 75 percent more teams and five percent more games per team). There have been similar dropoffs, as you can see, in relief appearances lasting five or more and four or more innings. So why are fewer pitchers getting pulled early? Because there’s no replacement for them. As counterintuitive as it sounds, a starter having a bad day has to wear it for the club rather than tax the seven- or eight-man bullpen. So far this year we’ve seen six pitchers (Masahiro Tanaka, Raul Alcantara, Jeremy Guthrie, Steven Wright, Josh Tomlin, Kevin Gausman) leave games after allowing seven or more runs in fewer than three innings. There were only eight such games in all of 1957, nine in 1963 and 1965, and 10 in 1940, 1964, 1967, and 1968. Part of that is run environment, but mostly it’s bullpens. In modern baseball, there’s nobody for mop-up duty. Struggling starters have to keep on struggling.
Rob Mains is an author of Baseball Prospectus. Follow @Cran_Boy
|
Interesting, thanks for doing this!
Thank you! I'm glad you enjoyed it. This is something I noticed last summer when I wrote a piece about the 1971 season. I noticed that there were a lot more super-short outings then than there are now.