


 4 comments have been left for this article.
 BP Comment Quick Links

|

|
March 10, 2017 Flu-Like SymptomsPower and Speed
Bill James popularized sabermetrics. Hell, he coined the term. Several of his measures, like runs created, are still in popular use today, and his work has formed the basis for many sabermetric advances. But James created other measures that combine whimsy with measurement. One is the power/speed number. It attempts to identify players who excel at both. It’s a simple formula: 2 x (HR x SB) / (SB +HR). That’s not #gorymath; it’s not even #goryalgebra, even if you add that it represents the harmonic mean of home runs and stolen bases. Now, there are plenty of limitations to defining power solely as home runs. It misses all other extra-base hits, of course. And stolen bases as a measure of speed? OK, but we have much more sophisticated ways to measure baserunning than stolen bases, and besides shouldn’t we be looking at stolen bases minus caught stealing? But James wasn’t looking to create the perfect measure of power and speed. He wanted to create an easy, back-of-the-envelope type of calculation. He succeeded. You need a lot of both home runs and stolen bases to have a high power/speed number. That’s how harmonic means work. A power/speed number of 30 or so will typically lead a league. Mark Trumbo led the majors in home runs last season, but his power/speed number was only 3.8 because he stole just two bases. Billy Hamilton was 58-for-66 as a basestealer but his power/speed number was just 5.7 because he hit only three homers. By contrast, Tim Anderson had just 10 stolen bases and nine homers, but his power/speed number of 9.5 was much better than Trumbo’s or Hamilton’s. Balance counts. The power/speed number is still in use. Baseball-Reference tracks it; you can look up career leaders, single-season leaders, and yearly leaders. The top 10 of all time are Barry Bonds, Rickey Henderson, Willie Mays, Alex Rodriguez, Bobby Bonds, Joe Morgan, Andre Dawson, Hank Aaron, Carlos Beltran, and Craig Biggio. The top 10 single-season power/speed numbers belong to Alex Rodriguez, Alfonso Soriano, Eric Davis, Rickey Henderson, Barry Bonds, Jose Canseco, Bobby Bonds, Barry again, Davis again, and Soriano again. The leaders for last season were Mike Trout (29.5), Jonathan Villar (29.1), Mookie Betts (28.3), Wil Myers (28.0), and Paul Goldschmidt (27.4). But I want to expand the focus from just individual players. You can calculate power/speed numbers for teams, too. Last year, the top power/speed number in the majors was Milwaukee’s 187.3. The lowest was Baltimore’s 35.3. This should not be a surprise. During a year in which everybody hit a bunch of home runs, the Brewers led the majors in stolen bases with 181, 42 more than anybody else. The Orioles had the fewest, a laughable 19, 16 fewer than anybody else. Granted, a team power/speed number doesn’t measure the combination of the two traits the way the individual figure does. A team full of Trumbos and Hamiltons will have a high power/speed number without having anyone with a high individual score. A team power/speed number tells us the way a club as a whole mixes home runs and stolen bases. Let’s look at power/speed numbers by team over the course of baseball history. Since power/speed numbers are a counting stat, we need to adjust the raw numbers for games played. The tables below list team power/speed numbers per 162 games. And I’m going to start by skipping all seasons before 1886, because there are no records for stolen bases from 1876 to 1885, and teams played only a few dozen games per season prior to that.
Here are the top 20 team power/speed numbers.
The three lines in italics represent strike-shortened years. If we exclude them, we add the 1977 Reds, 1997 Rockies, and 1987 Mets.
The 1996 Rockies are the only team in history with more than 200 home runs and more than 200 stolen bases. Andres Galarraga (47), Vinny Castilla (40), Ellis Burks (40), and Dante Bichette (31) led the club in homers. The stolen base leaders were Eric Young (52), Burks (32), Bichette (31), Galarraga (18), and Larry Walker (18). (In case you were wondering, they didn’t install the humidor at Coors Field until 2002.) Despite their record-breaking power/speed performance, the Rox went only 83-79 that year. Bichette somehow managed to go 30-30 and still post negative 0.4 WARP. His .313/.359/.531 slash line equated to only a .261 TAv, as Coors had runs and home run factors of 127 and 132, respectively, for right-handed batters. (Everybody listed above, save Walker, batted right.) The next-highest runs factor for righties was 107, the next-highest home run factor for righties was 113. So yeah, the Rockies’ record season was Coors-inflated, as they hit .343/.408/.579 at home and .228/.295/.357 on the road. But so what; as I said, this is designed to be a fun stat.
For the teams with the lowest power/speed number, I’m going to make the executive decision to exclude the Deadball Era (prior to the elimination of the spitball in 1920). Nobody hit home runs during the deadball years, which account for the 43 lowest team power/speed Numbers since 1886 and all but 11 of the lowest 132.
Note that the list of the highest power/speed numbers is fairly contemporary. Among the top 20 teams, there’s one team from the 70s, two from the 80s, 10 from the 90s, and seven from the 2000s. By contrast, the lowest power/speed teams are, with two exceptions, from the two-league, 154-game era: four from the 20s (Deadball holdovers with team home run totals in the teens), five from the 30s, two from World War II, and seven from the post-war, pre-expansion 1946-1960 years. Other than the four from the 20s, these teams were notable for their lack of stolen bases. The 1950 White Sox had only 19 stolen bases, and the American League leader that year was Boston’s Dom DiMaggio, with only 15. A lot of those post-war years were sort of a Deadball Era for stolen bases. (As it happens, White Sox players—Minnie Minoso, Jim Rivera, and Luis Aparicio—led the league in stolen bases in 11 of the 12 seasons following 1950.)
Unlike many baseball records, power/speed is a measure for which records aren’t frozen in amber, never to be eclipsed. Last year’s Brewers, led by Chris Carter’s 41 home runs and Jonathan Villar’s 62 stolen bases, had the seventh-highest team power/speed number of all time (fifth-highest excluding strike seasons). And last year’s stolen-base-averse Orioles posted the 23rd-lowest power/speed number among the 2,132 post-Deadball team seasons.
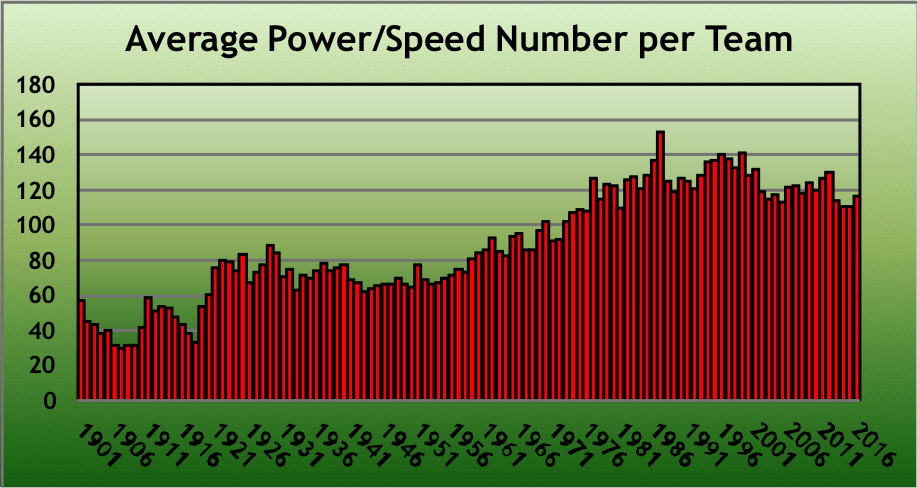
And how about baseball overall? Here’s a graph of MLB’s average power/speed number per team, again scaled to 162 games per season.
As I’ve noted, stolen bases are down from their 1975-1997 peak. But we’re still living in an era in which the athleticism that drives both stolen bases and home runs is at its highest level ever. The 40 seasons with the highest league power/speed number have all occurred since 1976, ranging from 110.0 in the strike-shortened 1981 to 152.9 in 1987. The vast majority of the people reading this article, I trust, were not alive the last time the average team power/speed number was below 110. Last season’s 116.6 clocks in as the 33rd-highest ever. If home runs and stolen bases are your beer and tacos, you can, in fact, have them both. ***
One addendum: The outlier season on the chart is 1987, when the average team’s power/speed number hit an all-time high of 152.9, 8.5 percent higher than the next-highest season, 1999. That year was notable for a surge in home runs:
Like the home run spike that began in the second half of the 2015 season, it was widely suspected that something was going on with the ball in 1987. As with contemporary baseball, MLB was mum. But unlike 2015, the home run surge in 1987 completely vanished the next year.
Thanks to Alex Crisafulli for reminding me of the 1987 season, getting this ball rolling.
Rob Mains is an author of Baseball Prospectus. Follow @Cran_Boy
|
"The vast majority of the people reading this article, I trust, were not alive the last time the average team power/speed number was below 110."
That year looks to be 1976. So the VAST majority of BP readers are 40 and under?
LOL as a 42-year-old I noticed that, too. Not that it made me feel bad or old or anything...
"Vast" may have been an overstatement. But as a fellow 40+ person, it sure FEELS that way sometimes.