


 17 comments have been left for this article.
 BP Comment Quick Links

|

|
January 23, 2017 Prospectus FeatureCommand and ControlAbout a year and a half ago, Baseball Prospectus revealed a suite of catching stats that formed the basis for our industry-leading valuation of catchers. These new stats would shape how we perceived and discussed catcher value, but they also opened the door to better understanding the performance of pitchers. Two key statistics—CSAA and CS Prob—serve as the basis for the pitch framing portion of our catching metrics. Today, we’ll show how those same statistics can tell us a great deal about pitching as well. CS Prob was initially introduced in 2014 with Harry Pavlidis and Dan Brooks’ first catcher framing model. Early the next year, Jonathan Judge joined the effort and the team introduced CSAA, officially moving our framing models beyond WOWY. Of the two, CS Prob—short for Called Strike Probability—is the more straightforward: the likelihood of a given pitch being a strike. CS Prob goes beyond what the strike zone ought to be and instead reflects what it is: a set of probabilities that depends on batter and pitcher handedness, pitch location, pitch type, and count. Good pitchers understand that while the strike zone is a dynamic construct, it nonetheless has some consistencies depending on which combinations of these factors are present. We calculate CS Prob for every pitch regardless of the eventual outcome. The other statistic, CSAA, stands for Called Strikes Above Average; a measure of how many called strikes the player in question creates for his team. In the case of catchers, we isolate the effects of the pitcher, umpire, and other situational factors which allows us to identify how many additional called strikes the catcher is generating, above or below average. For catchers, this skill is commonly described as “framing” or, in more polite company, “presentation.” For pitchers, we can apply a similar methodology—controlling for the catcher, umpire, etc. to identify the additional called strikes created by the pitcher. CSAA is calculated only on taken pitches, an important nuance. A pitch must be taken in order to be eligible to be called a strike by the umpire, so while CS Prob looks at all pitches, CSAA only takes into account pitches where the outcome is left up to the umpire. What can these two statistics tell us about pitcher performance and skill? First, we should define a few important things: Control – The ability to keep the ball in the strike zone, though not necessarily in any particular location within that zone. Command – The ability to precisely locate pitches, in or out of the zone, with the goal of keeping each pitch out of the heart of the plate.
Control At its core, CS Prob tells us the likelihood that each pitch is going to be called a strike. Having a high CS Prob is an indication that the pitcher in question is throwing a lot of strikes and largely keeping the ball around the strike zone. CS Prob fundamentally tells us which pitchers pound the strike zone, regardless of the quality of those offerings. Take for example this graphic that showcases, from the catcher’s perspective, some rough zones for called strike probabilities for a right-handed pitcher facing a right-handed hitter in an 0-0 count:
For the 2016 season, the inner most circle represents pitches that are called strikes 90 percent of the time. The larger second circle, which stretches from the top of the strike zone to below the bottom of it, includes pitches that are called a strike roughly half the time. Finally, the third largest circle, which stretches almost entirely outside the zone itself, represents pitches that go for a strike about 10 percent of the time. The reference strike zone is reflected by the black square, allowing you to see the difference between where the strike zone was supposed to be versus where it ended up being called. These zones change and shift based on the count, handedness of the batter or pitcher, and even the pitch in question. Overall though, pitchers who have a high average CS Prob are clearly working within the confines of the strike zone. There is a clear and obvious connection between the concept of control and CS Prob. Think of pitchers who pound the strike zone. Among pitchers with at least 100 innings, Bartolo Colon led the league with a 52.1 percent CS Prob. That is, any given pitch thrown by Colon has more than a 50 percent chance of being called a strike. The table below showcases the top 10 pitchers in the major leagues for 2016:
CS Prob is an important piece particularly as distinguished from the rulebook strike zone. Take the CS Prob champion, Bartolo Colon: during the 2016 season, Colon lead the majors with a 52 percent CS Prob. As we’ve established, that means that more than five out of every 10 pitches from Colon is likely to be called a strike. If Colon were subject to robot umps calling the rulebook strike zone, his Zone% tells us he would get strikes on 50 percent of his pitches. That means Colon is getting two extra strikes per 100 pitches simply because the strike zone that is called isn’t the one the rulebook lays out. Rich Hill on the other hand actually gets penalized, as his Zone% of 52.6 percent is higher than his CS Prob. Generally speaking, CS Prob and Zone% should correspond with each other because the called strike zone is generally pretty close to what the rulebook defines as the zone. Still, a few percentage points one way or another leads to a few more or a few less strikes over the course of a game. That could mean a few dozen strikes going the other way over the course of a season, and the value of a strike is sometimes really significant. Throwing pitches in the strike zone as defined by the rulebook isn’t necessarily a ticket to success; much like real estate it’s all about location, location, location. Command Now that we’ve established that CS Prob is a proxy for control, we can build on it. After extensive review, we’ve concluded that CSAA substantially reflects a pitcher’s ability to command his pitches. It’s important to make the connection between what CSAA does and the popular definition of command. Traditionally command is understood as the ability to “hit your spots”—having the ball end up where you intend it to. Over the years this has been studied in numerous ways—most notably by attempting to determine how much the catcher moves his glove to receive a pitch. This is flawed because the catcher’s glove isn’t always the target, and we can’t know where the pitcher is truly intending the pitch to go. What we can do is come at command from a different angle. A pitcher with good command should be more predictable for the catcher—their pitches often end up in the locations, and with the movement that the catcher expects. This skill results in easier receiving for catchers, and additional called strikes for the pitcher. Once we aggregate the data cross thousands of pitches, CSAA is able to tell us whether a pitcher is reliably hitting his spots. CS Prob is actually covariate in the model for CSAA, which is a fancy way of saying that CSAA measures the extent to which a participant tends to affect the likelihood of a strike being called, notwithstanding its final location. As such, CSAA controls for all of the same things as CS Prob and adds in the umpire and catcher for good measure. So what does accumulating CSAA look like? It’s not as easy as it sounds. Sure, you could throw a ton of pitches in the middle of the zone and basically guarantee that you’ll wrack up called strikes on the pitches hitters don’t offer at. The downside to that approach is that pitches in the center of the plate get crushed.
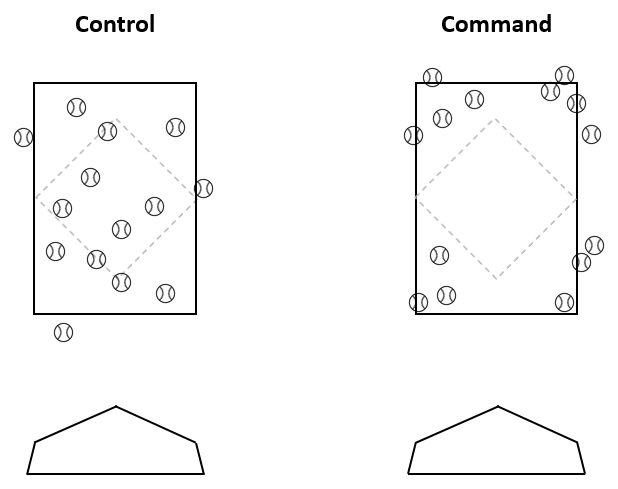
The best command pitchers actually have a somewhat interesting approach. They tend to work further outside the edge of the strike zone than you might think, trying to pick up extra strikes in the 20 percent or 30 percent bands for CS Prob. When working within the zone, they avoid the center of the plate—the 90 percent zone—and focus on something in the 75 percent range. The very best command pitchers—guys who are one standard deviation or more above the mean—also have a high propensity to throw pitches in the sub-10 percent band as well. When these guys are trying to work out of the zone, they really work out of the zone. That means spiked curveballs, down-and-out sliders, and eye-high fastballs. You can see in the chart below the density of offerings between the best and worst command pitchers and where they tend to concentrate their pitches along the spectrum of called strike probability:
You'll notice that most of the positive values are located in the bottom half of the CS Prob range: 0 percent to 50 percent. This means that the best command pitchers actually work outside the effective strike zone—especially in the 0 percent to 9.99 percent range—as compared to the worst CSAA performers. Simply put: if you have good command, you don’t have to throw as many strikes. Command thus differs from control because pounding the zone doesn’t necessarily mean that you’re hitting your spots. A guy like Clayton Kershaw can get away with having a high CS Prob (99th percentile) and an all right CSAA (69th percentile) because his raw stuff is so impressive. For someone like Colon, however, elite command (top six percent in CSAA) is critical to his success. Luis Perdomo combines throwing a lot of strikes with poor command (59th percentile CSAA) to disastrous results—nearly 1.5 home runs per nine innings. As such, command is something that you don’t need, provided you are blessed with dynamic stuff. For most pitchers, though, they need to work the edges of the zone effectively, gathering up extra strikes as much as possible in order to be successful. The best command/CSAA pitchers tend to be guys who produce good results despite seemingly lackluster or otherwise inconsistent stuff. The top 10 pitchers with a minimum 500 chances in 2016 are listed below (note: percentages here indicate how many more strikes the pitcher got than CS Prob would otherwise indicate).
A pitcher like Davies—a righty whose fastball barely broke the 90 mph barrier—needs to work those edges in order to be successful at the highest level of baseball. Throughout much of his career as a prospect Davies seemed destined to be a Quad-A player because of his unimpressive stuff, but the Brewers are now reaping the rewards of Davies’ command: his pitches are 3.5 percent more likely to be called a strike than the average pitcher. Command can be a powerful tool. For Davies, it converts a seemingly fringe prospect into a three-win pitcher. A decline in command also corresponds to the difference between Jered Weaver being a league-average pitcher a few years ago to whatever it is he was in 2016. Take a look at how his CSAA and WARP have changed over the past three seasons:
Suffice it to say that the margin for error for a pitcher with a mid-80s fastball is razor thin—maybe even less than 1.5 percentage points, if the table above is any indication. It’s not enough to simply look at Weaver’s declining CSAA and say that losing an extra strike or two per game hurt him so badly. His declining CSAA points to overall diminishing command. The result? More pitches over the middle and Weaver’s home run rate has soared, while his value has plunged in the other direction. *** Don’t just take our word for it. Historical CSAA and CS Prob stats are now included on our stats pages, so you too can pull data for pitchers like Weaver and assess the impact of improving or declining command on their careers.
There is one special case that's worth pointing out and discussing in some length. Tom Glavine’s 2008 season doesn’t seem overly special when you look at raw CSAA. His 5.3 percent mark is certainly impressive, but ranks just 120th among all seasons since 1988. Where Glavine’s season really shines is when you control for the era and seasonal factors. Creating Z-scores allows us to compare each pitcher to their peers, helping us better understand how they are performing compared to their peers that season. This is important because as PITCHf/x began being utilized by major-league teams and the league office, umpires started calling games differently. Specifically, they got a lot better and more consistent. That’s why Glavine’s 2008 season is so remarkable. His 5.3 percent CSAA is barely half of Greg Maddux’s best-ever mark, but that 5.3 percent was more than seven (!!!) standard deviations better than the mean for the 2008 season. By 2008 umpires had really improved in terms of calling the strike zone, but Glavine was still working like it was 1995. We would also be remiss if we didn’t mention the sheer dominance of Maddux, who from 1995 to 1997 was getting a strike bonus of 8–10 percent on every pitch he threw. That is, put bluntly, absurd. *** There are of course two ways to analyze and understand pitcher performance. Let’s use pitch movement as an example. We can look at PITCHf/x data and see that a pitch dropped 10 inches horizontally and traveled at 73.7 mph. We can also look and see that against that particular pitch opposing hitters swung and missed 15.4 percent of the time, hit ground balls 10.7 percent of the time, resulted in a strike (either via a called strike, a whiff, or a foul ball) 26.6 percent of the time. For the pitcher, the measurements are a means to an end. The most important thing is that the pitch delivers positive outcomes and/or helps set up other pitches to have positive outcomes. Having the best stuff in baseball doesn’t mean anything if you can’t get hitters out. Our approach to understanding command and control is rooted in the latter, as we look to describe the outcomes and intent related to pitch location. We’re able to do this by using CS Prob and CSAA to isolate the performance of the pitcher from all other influencing factors, and to establish an idea of how an ability to locate the ball—either in the zone, or precisely outside of the zone if need be—impacts the intended outcome. This is unlike COMMANDf/x, a methodology that uses glove movement to measure precision. Catcher movement can be helpful, but it can also be misleading. Being able to look at command and control through the lens of strikes is critical, because that is the currency in which pitchers trade throughout an at-bat. With CSAA and CS Prob, we believe that we’ve identified the tools to do just that.
Jeff Long is an author of Baseball Prospectus. Follow @JeffLongBP
|
Two thoughts:
(1) This is excellent research IMHO - carefully conceived and executed, and clearly presented. Well done and many thanks to all involved.
(2) I knew Jered Weaver had a rough year last year, but that -5.3 WARP figure is breathtaking.
DRA absolutely hates him. As we work on offseason updates, it's certainly front of mind. That said, our accuracy on how bad a pitcher really is who is indisputably bad is not exactly the zone most people / teams are interested in.
tomorrow we'll be able to see how much he relies on changing speeds, too. At least that part he's kept up, but ... not to much success.