
 3 comments have been left for this article.
 BP Comment Quick Links

|

|
February 3, 2016 Pitching BackwardBringing the Heat
One of the most important components of DRA is the awareness of external factors on pitching performance. Obvious things like the parks each player is pitching in, and the defense behind him, clearly affect performance. So too, does temperature. Derek Holland quite literally brings the heat. Sure, he threw a 94 mph fastball in 2015, but he also pitched in some of the highest average temperature games among all pitchers who recorded at least 162 outs last season. Holland started 10 games for the Rangers, the average temperature of which was over 81 degrees. That’s nearly 8 degrees warmer than the average gametime temperature last season. Jesse Hahn, on the other hand, kept things ice cold. The average temperature of Hahn’s outings was a chilly 65 degrees. Hahn’s starts were roughly nine degrees cooler than average last year. The temperature of baseball games can range widely, as anyone who has sat in Camden Yards’ heat-only pressbox can attest. A hot summer day in Texas can easily break triple digits. Case in point, the 101 degree gametime temperature on July 30th for a Yovani Gallardo/CC Sabathia matchup in Arlington. On the other side of the coin, Anibal Sanchez and Masahiro Tanaka worked in near freezing temperatures during their April 23rd starts in Detroit, where the game time temperature was just 33 degrees.
There is very clearly a relationship between latitude and average temperature. This is obvious to most anyone who has lived on the planet. How does that come through when it comes to baseball? Below is a table with the latitude and average gametime temperature for each team, and more importantly city, in major-league baseball:
What does all this mean? As one might expect, there’s a decently strong negative correlation (-.381) between temperature and latitude; that is, as latitude decreases, temperature increases. In general, the further south we get, the cooler it gets. It’s not a hard and fast rule of course, as St. Louis is warmer than San Diego on average[ii], but the rule is generally sound. The real question then is why we’re paying so much attention to the temperature of games. The simple answer is that it impacts games. Sure, extremes on either end of the spectrum can have clear and obvious impacts on performance. It might be harder for Sanchez to get a good enough grip to spin a proper curveball when it’s 33 degrees outside, or Anderson’s grip might slip a bit under the 105 degree sun. Those things are obvious. The run value of each degree of temperature can be derived from the DRA calculation. It tells us that 30 degrees of temperature is worth about 1.3 runs per game—split between both teams, of course. That means that a 100 degree day sees roughly 2.5 more runs than a 40 degree day. This is an oversimplification, since the temperature component of the DRA model is very complex, but it’s effective for the purpose of highlighting how important temperature can be, though we pay little attention to it. Our DRA run values allow us to see how much temperature impacts pitcher performance over the course of a season. On the high end of the spectrum it can save a few extra runs, or it can cost a few extra runs. We’ll once again use guys from either end of the spectrum to get a sense of what temperature can do for a pitcher. Colby Lewis made 33 starts last season, recording 614 outs in the process. The average temperature of those starts was nearly 80 degrees, ranging from 54 to 99. Our DRA model credits 3.2 runs to Lewis in 2015 because he so often pitched in high heat games where the ball carried. The goal of DRA is to account for as much context as possible to identify true talent, which conveniently allows us to measure and assess the impact of that context. DRA credits Lewis for pitching in high-temperature games, indicating that his actual performance suffered by an equal amount because of temperature alone. Lewis had 17 starts in Arlington last season, the ballpark with the highest average temperature in 2015. Rick Porcello provides a look at the other end of the spectrum. Porcello often started in cold games, a byproduct of playing for the Red Sox. DRA strips three runs away from Porcello’s performance because of his good fortune in pitching in mostly cold games. His 28 starts had an average temperature of 68 degrees, more than 5 degrees cooler than the average game last season. His coldest game, also his first start of the season, was just 40 degrees. Below is a heatmap that shows the temperature for every game last season: 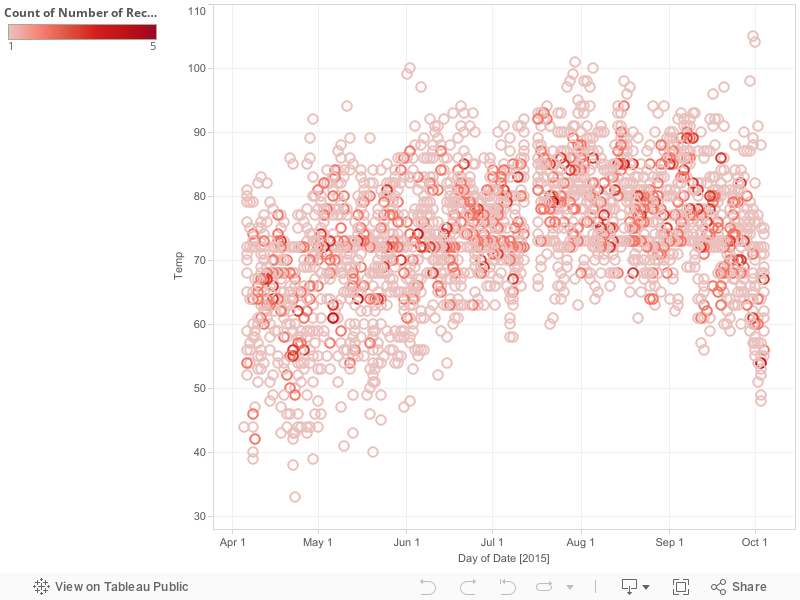
Each point represents a game, or multiple ones if there were several at the same temperature on a given date. Hovering over an individual game will tell you the date, temperature, and who played.[iii] It’s pretty incredible how on one day the temperature of games can range more than 50 degrees, as on June 2nd. It’s easy to see how with a little bit of luck a pitcher for a colder-climate team could reap the benefits of pitching in chilly games, while pitchers in Arizona[iv] or Texas get the short end of the stick. *** Temperature isn’t the most significant thing that impacts a pitcher’s performance. Far from it. It does, however, play a role, so it can’t be dismissed out of hand. Despite the impact that temperature can have on the game, there are still so many things we don’t yet know about the role temperature plays. DRA has helped us begin to understand it—breaking it out from park factors for the first time. This is just the beginning of deepening our understanding of the relationship between temperature and pitching. [i] Game time temperature is consistent due to a dome. [ii] At least based on the average temperature at game time from 2015. [iii] Except points with multiple games, those won’t have the same level of detail as an individual point. [iv] Speaking of Arizona: You’ll notice that some of the highest temperatures on the chart above come from Arizona. Arizona is noteworthy because of Chase Field’s retractable roof and panels. For much of the summer, the roof is closed to keep the temperature inside the stadium palatable, though the numbers reported are still sometimes the external temperatures. The official reading for Chase Field might be 105, as it was on September 30th, but inside the roof the facility’s impressive air conditioning keeps it somewhere between 70 and 80 degrees. This means that the numbers reported by MLBAM aren’t necessarily the best indicator of how the temperature is actually impacting the play on the field. (It’s unclear at this time whether this protocol impacts all stadiums with retractable roofs or not. Chase might be unique since the primary function of the roof is to minimize the impact of the hot sun, but we can’t be sure without checking in with each team who plays in a stadium like Chase Field.)
Jeff Long is an author of Baseball Prospectus. Follow @JeffLongBP
|
Cool. I've always wanted to know the relative lattitudes of the Major League cities!