


 12 comments have been left for this article.
 BP Comment Quick Links

|

|
November 9, 2015 Prospectus FeaturePassed Balls and Wild Pitches: Getting It RightRecently, we overhauled our approach to how we evaluate passed balls and wild pitches here at Baseball Prospectus. It started innocently enough, as an attempt to make our data better-behaved, but progressed to a gradual recognition that we—and as far as we can tell, plenty of others—have been taking the wrong approach to these events for quite some time. Today, we’ll talk about what we’ve learned, and how our models are much the better for it. Background As with all things sabermetric, the means of adjustment for these factors have become more sophisticated over time. At the simplest level, we could simply trust the official scorer, and assume the other factors largely balance out. A more sophisticated approach is the “With or Without You” method, which grades a catcher based on how he does without certain pitchers, or how pitchers do without various catchers. Going one step beyond, researchers have tried to identify relevant factors driving passed balls and wild pitches, incorporated them into models of “likely” passed ball/wild pitches versus “actual” such events, and then grading a catcher on the difference. FanGraphs has adopted a model created by Bojan Koprivica as the basis for its Runs per Passed Pitches (RPP) metric. (The parameters of that model appear to be proprietary, although Bojan does describe the relevant aspects). Finally, we unveiled our own blocking model last year, called “RPM WOWY”: a combination of PBWP likelihood, as determined by PitchInfo, followed by a WOWY assignment of credit among catchers and pitchers. When we began incorporating mixed models into our catcher metrics earlier this year, we converted our catcher blocking model over as well, since it made sense to have all our catcher metrics on the same basic method. And so, throughout the 2015 season, we combined all of what we now call “errant pitches” into a linear mixed model, specified as follows in the R programming environment: glmer(PBWP ~ log(prob) + (1|pitcher) + (1|catcher), family=binomial(link=’probit’) The model was, frankly, a bit of an afterthought. We were focused more on converting RPM WOWY into our new framework rather than thinking it over from scratch. The log transformation of errant pitch probability (the former “RPM,” and the “prob” in the new blocking model) was added as much to assist convergence as anything else. And yet, the model continued to behave somewhat erratically over the course of the season. The values were not unreasonable, but convergence continued to be an occasional problem, finally culminating in us taking it down a few weeks ago. Around the same time, we worked with August Fagerstrom, who was looking for data that would help investigate the role of R.A. Dickey in Russell Martin’s pitch-blocking this year. I proceeded to run the model both with and without knuckleballs, and August wrote about the findings. The answer: Martin was terrible at blocking pitches this year even when not catching knuckleballs. All of this, combined with the conclusion of the regular season, provided good reason to dig a little deeper and start questioning not only how our models could be better specified, but also some of our core assumptions. When we did so, we were surprised at what we learned. We’ll now share those lessons with you. Trusting the Official Scorer But it turns out that treating passed balls and wild pitches as identical is wrong. This became increasingly clear as we studied the probability metric (prob) that we were using for errant pitches. Although the combination of pitch type and pitch location was helpful in predicting wild pitches, it was essentially useless in fitting passed balls, with a correlation of about 1 percent. In other words, passed balls have almost nothing to do with the type of pitch thrown or the location where the pitcher throws it. This makes sense, in that a pitch is generally graded as a passed ball only when the catcher has little excuse for not catching it. This also suggests that official scorers are doing a good job — or at least being conservative — in assigning passed balls to catchers. In fact, when we started separating out the various components of the errant pitch probability metric, we found there to be only one factor, aside from the identity of the catcher, that made any difference in predicting passed balls: the knuckleball. With knuckleballs, the usual ratio of passed balls to wild pitches for other pitch types is reversed, with passed balls being the more common error. In fact, the importance of the knuckleball was significant at a level less than 2e-16. This, in a way, also makes sense. Passed balls are assigned when the pitch arrives at a location where the official scorer thinks an average catcher with reasonable effort could have caught the pitch. The knuckleball, of course, is unusually unpredictable, making it more likely a catcher will be fooled even by a knuckleball at “catchable” height. The significance of the knuckleball in our new passed-ball model confirms that this pitch remains the one “blind spot” in official scoring of passed balls. By adjusting for it in our new model, we help protect catchers from the unfairness of having to catch a knuckleballer. The irrelevance of pitchers to passed balls can be confirmed statistically. We test this hypothesis by adding the category of “pitcher” to the categories of “knuckleball” (yes / no) and “catcher” and seeing if the identity of the pitcher, once we control for knuckleballs and catcher, has any remaining effect on the probability of a passed ball. For 2015, the model outputs the following:
In mixed models, we are interested in the variance of our groups, a/k/a “random effects”: a variance of 0, or close to it, confirms that a particular group of players does not affect the outcome of whatever is being modeled. Here, since we are controlling for knuckleballs, the pitcher, with variance of 0, is otherwise irrelevant in the causation of passed balls. We therefore removed pitchers from our passed ball model entirely, and let knuckleballs and the identity of the catcher be the sole predictors of interest.
The Polynomial in our Midst
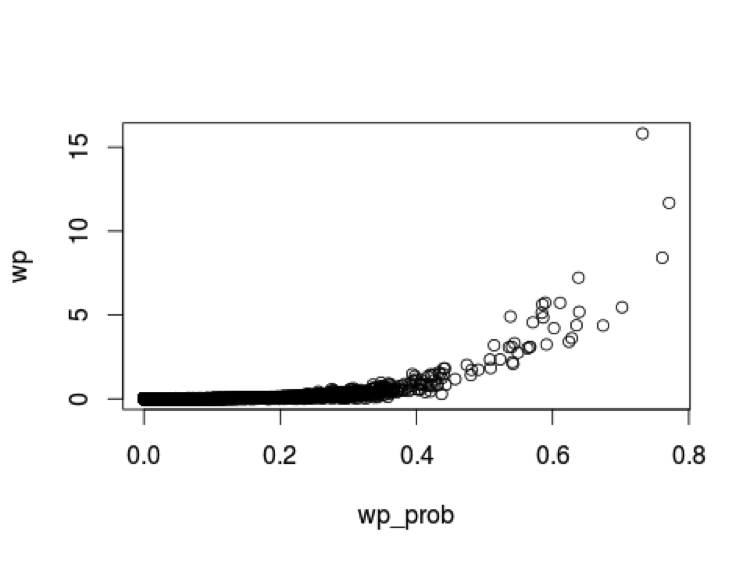
With respect to wild pitches, our existing probability formula remains quite useful: The 2015 correlation between wild pitch probability and an actual wild pitch is .4. Not bad at all. But the most startling thing about this relationship is evident when we plot those data points against each other, here for the 2015 season:
Our mathematically inclined readers will spot what is going on here right away: The predictor, now rechristened wp_prob, certainly has a strong connection with wild pitches. But more importantly, wild pitch probability operates on an exponential curve. It turns out that the best fit of wp_prob to wild pitches is a fourth (!) – degree polynomial function, and the improvement made by the addition of that polynomial is clear when we use generally-accepted indications of model quality. Here is the likelihood ratio comparison between each degree of the polynomial, as indicated in the model titles:
The fourth-degree polynomial is clearly superior.[i] This was something we missed before, and have now incorporated. The Catcher’s Role in Wild Pitches
Incorporating our fourth-degree polynomial, and using our typical pitcher and catcher categories, we get this summary:
Well now: This fit suggests that the catcher plays virtually no role in the likelihood of a wild pitch. This seems odd, given that we are pretty confident some catchers are much better at preventing wild pitches than others. It’s as if the model is saying: “The effect is there, just not in the way you are asking for me to look for it.”
So, let’s think about this. We believe that catchers play a role in stopping wild pitches from happening, but the model is reporting that this hypothesized skill does not manifest itself on a consistent basis. Why would that be? Our hypothesis focuses on the fact that major-league pitchers have decent command and stick with pitches they can consistently locate. For these pitchers, having extraordinary blocking skills isn’t that important. On the other hand, if a lot of team innings are being eaten by a pitcher or pitchers that tend to throw balls in the dirt, those blocking skills would be very useful indeed. Essentially, what we need to do is relate the blocking skill of the catcher to particular pitchers. Let’s try it and compare the results:
As you can see, the results are very similar, but the likelihood ratio test confirms that the pitcher-catcher version of the model is the better one. So, let’s now re-run the model, but with only pitcher and pitcher-catcher as our groups:
And . . . oh dear. The pitcher-catcher interaction wasn’t just the key to understanding the catcher’s contribution; it covers the pitcher’s contribution too. Which is to say, wild pitches really are all about the relationship between the skill sets / tendencies of particular pitchers with particular catchers. With a variance now of 0, “pitcher” needs to be removed too. That brings us to our final, and the best, wild pitch model:
This turns out to be the answer. Our final wild pitch model has the best AIC, the BIC, and was confirmed by a likelihood ratio test to have the best explanatory power (p<2e-16) among all models considered.
The Change in Distribution Previously, our model treated the occurrence of a passed ball or wild pitch (combined, of course) as part of a binomial distribution. On the surface, this seemed like a natural choice: You either have a PBWP or you don’t, which makes it 1 or 0. Moreover, most statistics education begins with binomials and the classic coin flip as a means of explaining probability, so the binomial distribution is a natural “default” of sorts for this type of data. Except that here this assumption is wrong. The idea behind the binomial distribution is that each event has approximately an equal chance of occurring at each unit of measurement (here, a PA). That’s not even remotely true of passed balls or wild pitches, which are very rare events: Out of 203,183 opportunities during the 2015 season, there were only 1,549 wild pitches and 285 passed balls. These events also have other interesting qualities. Their respective mean likelihoods and the variance are almost identical. Furthermore, the distribution of passed balls/wild pitches for any pitcher-catcher tandem can never be less than zero, and can only climb by one integer at a time. In other words, you can have three wild pitches, but you can’t have -4 or 7.25 wild pitches. There is, of course, a well-recognized distribution that is designed for rare events, which can never be negative, increases only by integer, and which assumes substantially similar mean and variance: the Poisson distribution. Switching from a binomial to a Poisson distribution is actually the key to the whole thing. Not surprisingly, when you choose a distribution that more accurately characterizes your data, your results get better and your model becomes more stable. And so, our final mixed models for passed balls and wild pitches, as specified through the lme4 package of the R programming environment, are as follows: glmer(passed_ball ~ KN + (1|catcher), family='poisson', nAGQ=0) glmer(wild_pitch ~ wp_prob + I(wp_prob^2) + I(wp_prob^3) + I(wp_prob^4) + (1|pitcher:catcher), family='poisson', nAGQ=0) If you calculate the two models, predict both of them onto the original data set, and then summarize by catcher and pitcher the model’s total expectation over all of their opportunities for both events, you get the models’ composite prediction of what we call Errant Pitches fairly attributed to each pitcher and catcher. Our final rate statistic for Errant Pitches is Errant Pitches Above Average, or EPAA.[ii] Out of Sample Testing So, we’ve found excellent descriptive fits to the data. But, of equal interest is how consistently these models identify the same abilities in these same individuals. In other words, does a catcher’s passed-ball rate in the first-half of the season suggest to us what that rate will be in the second-half of the season? And similarly, should we expect a strong pitcher-catcher wild-pitch combo to retain its effectiveness down the stretch? The answer to both questions is yes. In fact, these models show some of the highest reliability I have seen in baseball statistics. To generate them, I randomly split each season from 2010 through 2015 into two equal halves, ran the models separately on each half, repeated this for each season 20 times, and then took the average correlation for each model between the two halves over all 20 splits for each season. For simplicity’s sake, I limited the predictions to passed balls for catchers and wild pitches for pitchers. Here are the results:
As you can see, our new models not only fit the data, but they do so consistently as well.[iii] If you want to know the true talent of a particular catcher at blocking pitches, these models are an excellent place to start. The Effect of the Models Finally, we’ll provide the catchers who benefitted and suffered the most from their batterymates during the 2015 season:
And here are the top and bottom pitchers:
That will do it for now. As always, we welcome your comments.
[i] Polynomials of any higher degree begin to degrade the fit, and would be problematic for prediction in any event. [ii] To get the Errant Pitches Above Average (EPAA), we take the predicted number of Errant Pitches, subtract the actual number of Errant Pitches, and divide them by the number of opportunities for each player. [iii] It’s important to note that “prediction” here is not necessarily the same as an actual projection, although these numbers should help with that as well when used appropriately.
Jonathan Judge is an author of Baseball Prospectus. Follow @bachlaw
|
This probably falls into the category of "unknowable," but if there were only 285 passed balls during the whole season, I wonder how many of those were a result of the pitcher "crossing up" the catcher and are therefore not really attributable as a physical mistake of the catcher but a mental mistake that could be attributed to either the catcher or the pitcher (which one, of course, definitely falls into the category of Unknowable unless one of the players cops to it).
Maybe it doesn't even matter for the purposes of predicting future events, but it seems like a different category from your run-of-the-mill passed balls.
I think that's entirely possible, but if the passed balls were just flukes I don't think the numbers would be so consistent when the seasons are split in two. To the extent the catchers seem to be having a problem, it is a consistent one, and at some point they're the ones that aren't getting the signal across for some reason or another. Good point though.