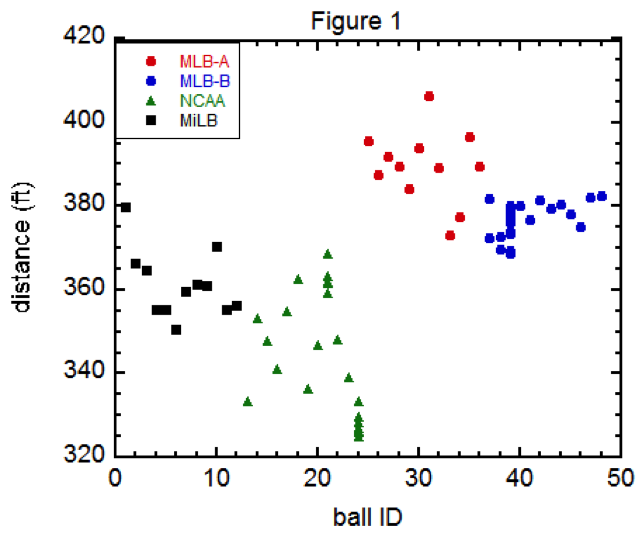
 The first and most obvious conclusion from this plot is that there is a tremendous variation in fly ball distance, which ranges from 325 ft to 406 ft. The spread among the raised-seam NCAA balls is especially large. Not only is there variation both from one ball lot to another but also, to various degrees, within a given ball lot.
 All ball lots except for MLB-B were launched with spins in the relatively narrow range of approximately 1500-1900 rpm, so that the large variation of distances among those balls should be due primarily to variations in drag properties (i.e., the Cd values) of the different balls. A remarkable feature of Figure 2 is that every fly ball in the MLB-A set had a longer distance than any fly ball in the NCAA set. From Table 1, we see that the average distance for the flat-seam MLB-A baseballs is an astounding 43 ft greater than that for the raised-seam NCAA baseballs. The type of baseball really does matter, and our measurements provide quantitative evidence that a flat-seam baseball carries much better than a raised-seam baseball. Moreover, judging from the spread of distances, the flat-seam baseballs are more uniform in their carry than the raised-seam baseballs.
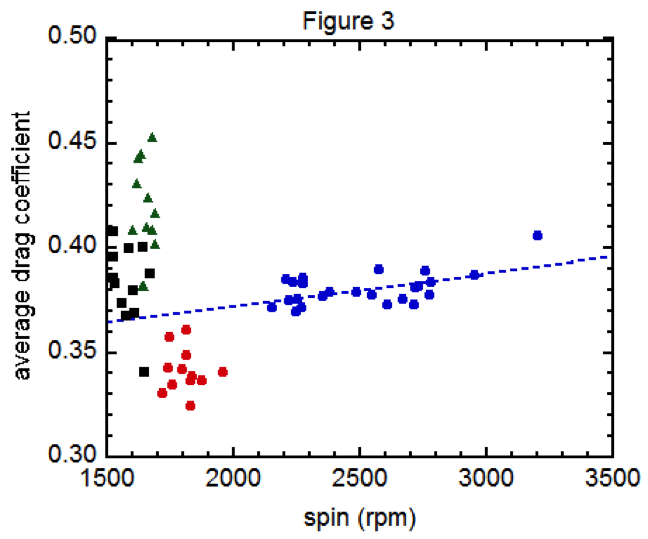 For spins below 2000 rpm, i.e. for balls other than the MLB-B lot, the ball-to-ball variation in Cd obscures any possible variation of Cd with spin. However, with more uniformity in the MLB-B lot, there is clear-cut evidence in the data for an increase in Cd with increasing spin, as indicated by the dashed line. The data are consistent with about a 4 percent increase in Cd for each 1000 rpm increase in spin.
 It clearly shows that the Magnus force (the “lift”) increases with spin, exactly as expected. So the combined effects of the drag increasing with spin (which tends to reduce the carry) and the lift increasing with spin (which tends to increase the carry) results in a cancellation and very little change in distance with increasing spin. This conclusion is quite intriguing to us and will almost surely lead to further experiments of this type. In particular, it would be of great interest to explore the spin dependence of distance over a greater range of initial speeds and launch angles. For example, we suspect a greater increase of distance with increasing spin for balls hit at low launch angles, such as line drives. But further experiments will be need to nail this down.
 9 comments have been left for this article.
 BP Comment Quick Links

|

|
December 9, 2014 Prospectus FeatureHow Far Did That Fly Ball Travel (Redux)?
How Far Did That Fly Ball Travel (Redux)?
Alan Nathan#, Jeff Kensrud*, Lloyd Smith*, Eric Lang#
#Department of Physics, University of Illinois
*Sports Science Laboratory, Washington State University
A couple of years ago, one of us wrote a ProGuestus article entitled "How Far Did That Fly Ball Travel?". The article posed the question: How well does the initial velocity vector (speed and angles) determine the landing point of a fly ball? Utilizing HITf/x data for the initial velocity and ESPN Home Run Tracker for the landing point and hang time, it was determined that the initial velocity vector poorly determines the landing location. Specifically, with a narrow range of initial speed and launch angle, distances in the range 370-440 ft were observed, with a mean of 405 ft and a standard deviation of 16 ft. Much of the rest of the article was devoted to speculation about why that is the case. Variations in air density due to temperature, elevation, and related effects were eliminated by only considering home runs hit in a narrow range of air density. A similar range of distances was observed in covered stadiums, thereby eliminating wind as the primary factor. Two other possible reasons were identified and investigated: variation both in backspin and in the air drag properties of the baseball. The latter is a very intriguing possibility, since variation in the seam height and/or surface roughness of the ball might have a significant effect on the air resistance experienced by the ball.
As a follow-up to this research, we decided to do an experiment under more controlled conditions rather than use MLB game data. Since we wanted to eliminate wind as a possible factor, we approached the Houston Astros organization about using Minute Maid Park (MMP) with the roof closed for our experiment. To our delight, they agreed. So, the four of us gathered in Houston for two cold days last January for the experiment.
A very fancy pitching machine, designed and constructed by the Washington State part of our collaboration, was set up at home plate and used to project baseballs into the outfield with complete control over the initial speed, angles, spin rate, and spin axis. A high-speed video camera viewed the initial part of the trajectory to measure both the initial velocity vector and the spin rate. The landing point was measured with excellent precision using a very long measuring tape. And all these quantities—initial speed and angles, spin rate, and landing point—were redundantly measured along with the hang time with two independent TrackMan units. One was the unit that is permanently mounted high above the field in MMP, the other is a portable unit from WSU that was mounted behind home plate a few feet above field level.
While the primary goal of the experiment was to determine what factors besides the initial velocity vector determine the landing point, the redundancy in our experiment afforded us the opportunity to test how well TrackMan stacks up against the more conventional techniques. That part of the experiment was written up in a ProGuestus article “Testing TrackMan” earlier this year, where we found that the two techniques agree remarkably well. Therefore, it really makes no difference which one is used for the analysis that follows. We have chosen to use the tape measure for landing point and TrackMan for everything else.
Before looking at the results, we present some additional details about the experiment. The pitching machine was used to project fly balls into the outfield in a narrow range of initial speed (~96.0 mph), vertical launch angle (~280), and horizontal (“spray”) angle (~00, corresponding to straightaway center field). All baseballs were projected in the four-seam orientation, with pure backspin and spin rates in the range 1500-3200 rpm. Four different one-dozen lots of new baseballs were used. These included two different one-dozen lots of MLB balls (hereafter called MLB-A and MLB-B) and one dozen each of MiLB and NCAA (raised-seam) balls. A total of 73 fly balls were analyzed. The temperature was carefully monitored throughout the experiment and never varied by more than a few degrees F, so that the air density never varied by more than 1 percent.
While the range of initial speed and vertical launch angle was quite narrow, it is important for our analysis to correct for whatever small differences occur. We do this using the following technique. Given the initial velocity vector, an aerodynamics model is fine-tuned to reproduce the landing point and hang time. This is achieved by adjusting two parameters: the average drag coefficient Cd and the average lift coefficient Cl. Recall that Cd is related to retarding force due to air resistance and Cl is related to the upward Magnus force due to the backspin. Once these parameters are determined, the same aerodynamics model is then used to calculate the trajectory with a fixed initial speed of 96 mph and vertical launch angle of 280. From this calculation we obtain the normalized flight distance D, which is the distance the fly ball would have traveled had it been projected with a speed of 96 mph and a launch angle of 280. The differences between the actual and normalized distances were small, typically in the range ±5 ft. All the remaining analysis in the article refers to the normalized distance D. And as an added bonus we have obtained the average drag and lift coefficients for most of the fly balls, and these will play a prominent role in our analysis.
The results of the experiment are presented in Figures 1-4, while summary information about each of the four baseball lots is presented in Table 1.
Table 1. Mean values and standard deviations for each ball lot.
Figure 1 shows the normalized distance for each fly ball indexed by its identifying number and color-coded by ball lot.
As a check on the reproducibility of the data, balls 21 and 24 (both NCAA) and ball 39 (MLB-B) were launched multiple consecutive times under identical conditions. Figure 1 and the summary in Table 1 show excellent consistency. In particular, note that balls 21 and 24 had the largest and smallest distances, respectively, among the NCAA balls and these extreme values are confirmed with multiple launchings. Moreover the spread of distances for the repeated NCAA measurements on the same baseball is considerably smaller than for the lot as a whole. This result gives us confidence that the variation in distance that we observe among different baseballs is a real effect.
Figure 2 shows the normalized distance as a function of the spin.
Another remarkable feature of Figure 2 is that the normalized distance is nearly independent of backspin over the range 2200-3200 rpm covered by the MLB-B baseballs. How do we account for this feature? We get a clue by examining Figure 3, which show Cd as a function of spin.
Now take a look at Figure 4, which shows Cl as a function of spin.
We note in passing that the observed increase in drag with increasing spin has previously been observed in laboratory experiments done by one of the authors. Moreover, the Cl-versus-spin data in Figure 4 looks quite smooth (except for two outliers), with a somewhat steep slope below 2000 rpm followed by a more gentle slope for higher spin. That general shape is roughly in accord with data from laboratory experiments.
If the dashed line in Figure 3 is used to extrapolate the MLB-B results to lower spin, we find that the Cd values for MLB-B exceed those of MLB-A. That is, the two ball lots really are different in their drag properties. This is another important conclusion from this experiment: All MLB baseballs are not the same!
Let’s now summarize the important things we have learned from our experiment.
It is our pleasure to acknowledge and thank the Houston Astros organization for making Minute Maid Park available to us and for helping make the experiment a success. A special word of thanks goes to Mike Fast and Ben Lowry for their help. We also thank the good people from TrackMan for their help in reconfiguring the stadium unit at MMP and from Rawlings for providing the baseballs.
|
Was there any attempt to measure the physical differences between the balls in each MLB lot? If not, what do you think is responsible for the variation in distances?