 21 comments have been left for this article.
 BP Comment Quick Links

|

|
December 3, 2014 MoonshotThe Power of Projections
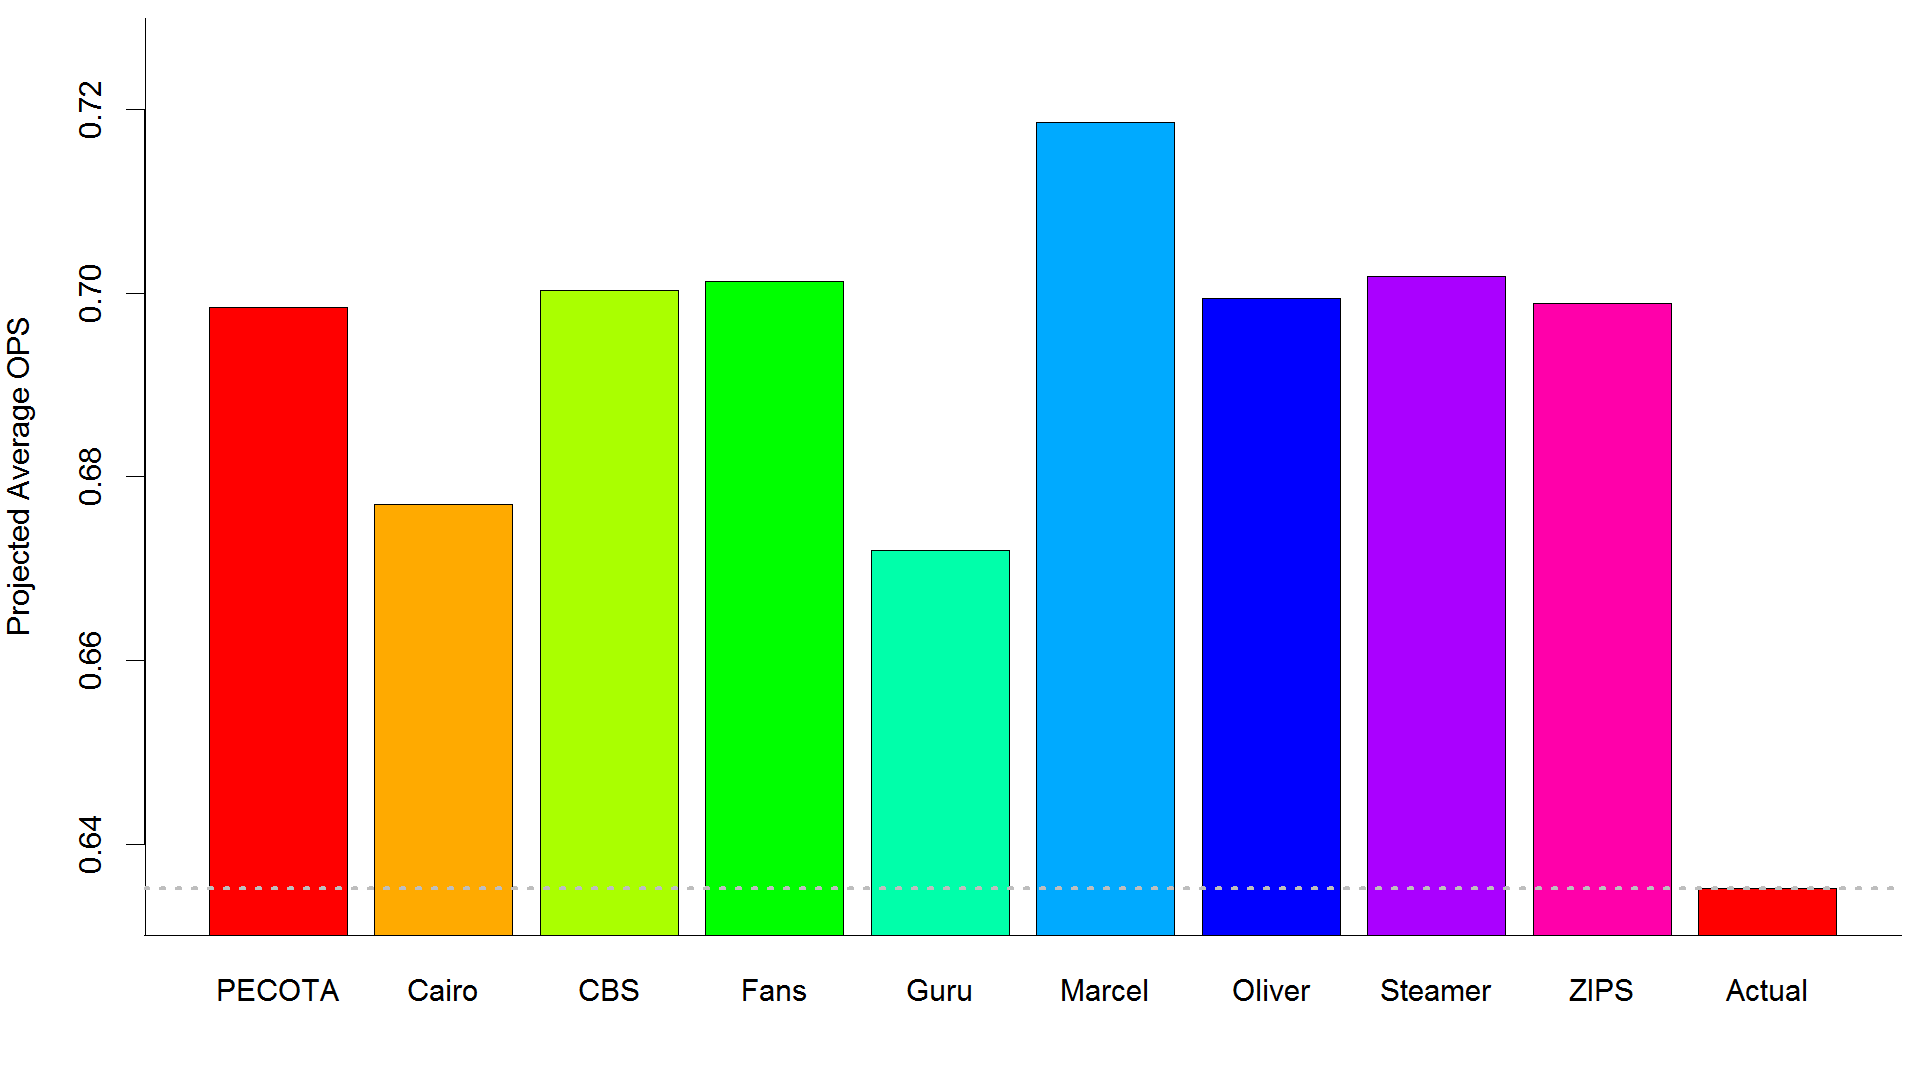
It’s around the time that projection engines are being tweaked, updated, and improved, in anticipation of the release of new predictions for the coming year. At Baseball Prospectus, Rob McQuown is hard at work ironing out the kinks for this year’s release of PECOTA. Given the present focus on predictions, the time is ripe for a retrospective look at how the projections fared last year. There’s no better source for a large-scale comparison of projection algorithms than Will Larson’s Baseball Projection Project, which I will use for this article. Larson’s page houses the old predictions of as many different sources as he can get his hands on, including methods as diverse as Steamer, the Fan Projections a FanGraphs, and venerable old Marcel. It’s a rich storehouse of information concerning the ways in which we can fail to foresee baseball. The most obvious task when confronted with the contrasting predictions of a series of algorithms is to compare them and pick a winner. I am going to refrain from doing so. I am not an unbiased observer. As much as I’d like to make a pretense of objectivity, there are sufficiently many free parameters in any such comparison of projections that I could never guarantee that I wasn’t tilting the competition to favor PECOTA. These types of comparisons are best done by third parties on multi-year samples of projection engines. Instead I aim, by gathering the predictions of nine separate algorithms*, to get a better sense for the scope and scale of prediction accuracies and errors. I’ll concern myself only with hitters for now, and limit it to just this past year, 2014. As a global metric of offense, I’ll rely upon OPS, not because it’s the best, but because all the various systems make predictions for it. The first striking finding is that by and large the systems do a decent job at predicting who will be good and who will not. The root mean squared errors (RMSE), a measure of prediction accuracy, all fit in somewhere between .16 and .19 for different projections, implying that a hitter’s OPS can be guessed to within about 200 points. These RMSEs drop to ~.1 if you apply a 200 PA threshold, which eliminates some small-sample abnormalities. That’s not perfect or even close to it, but it shows that good players can be distinguished from bad players with relative certainty. One reason that the RMSE is so elevated is due to the shifting run environment in the league. Some projections undoubtedly make an effort to account for the most recent trends, but because the algorithms are inherently backward-looking, they’ll tend to damp out whatever larger tendencies are occurring in baseball (such as the recent freefall of offense). This effect can be observed quite clearly in the estimated average OPS of 511 players, relative to the actual OPS of those same players:
Every single prediction puts the average OPS of these players substantially (30 to 70 points) higher than the actual OPS achieved by the players. Some of this effect is due to survivor bias, but even if you apply strict plate appearance cutoffs, the prediction algorithms (as a group) expected hitters to produce 10 or so more points of OPS than they actually achieved. In times of great change in the league, prediction systems are going to become less accurate in an absolute sense. Everyone knows that the strike zone is growing, or maybe now shrinking, but at any rate changing, and that movement is shaping the run environment to a large degree. There are also innumerable other factors at play, including increasing average fastball velocity and the advent of the modern hyper-specialized bullpen. To whatever degree all of these factors combine to shift the run environment, the prediction algorithms will be greatly confused. Because all of the predictions are essentially historical in nature (utilizing the rich information of prior baseball careers), the rare eras of great upheaval in the run environment will be the most difficult to predict. All systems miss on the same players The greater part of the players in MLB fall into the easy-to-predict camp. Such is the state of the predictions nowadays that about half of all players can be forecast to within 50 points of their actual OPS values. These players are not problems for the prediction algorithms, provided they don’t get injured.
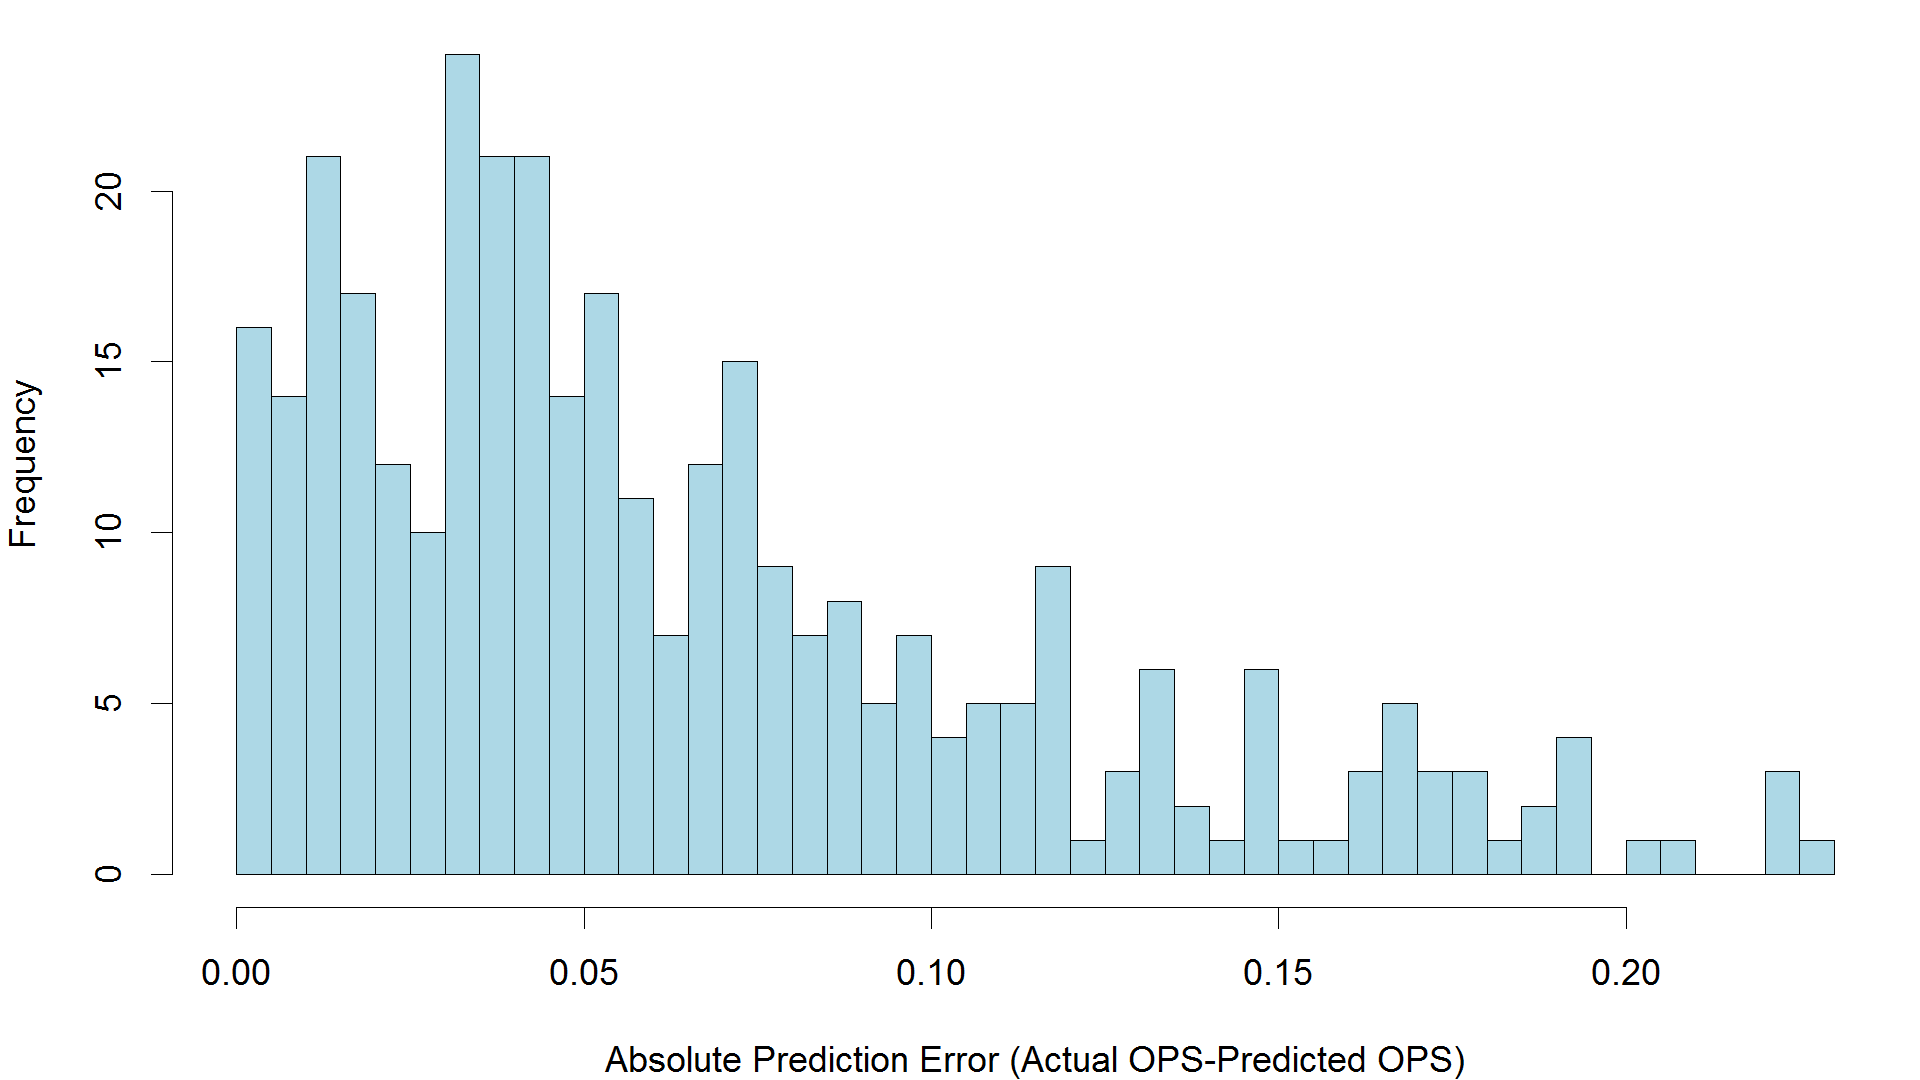
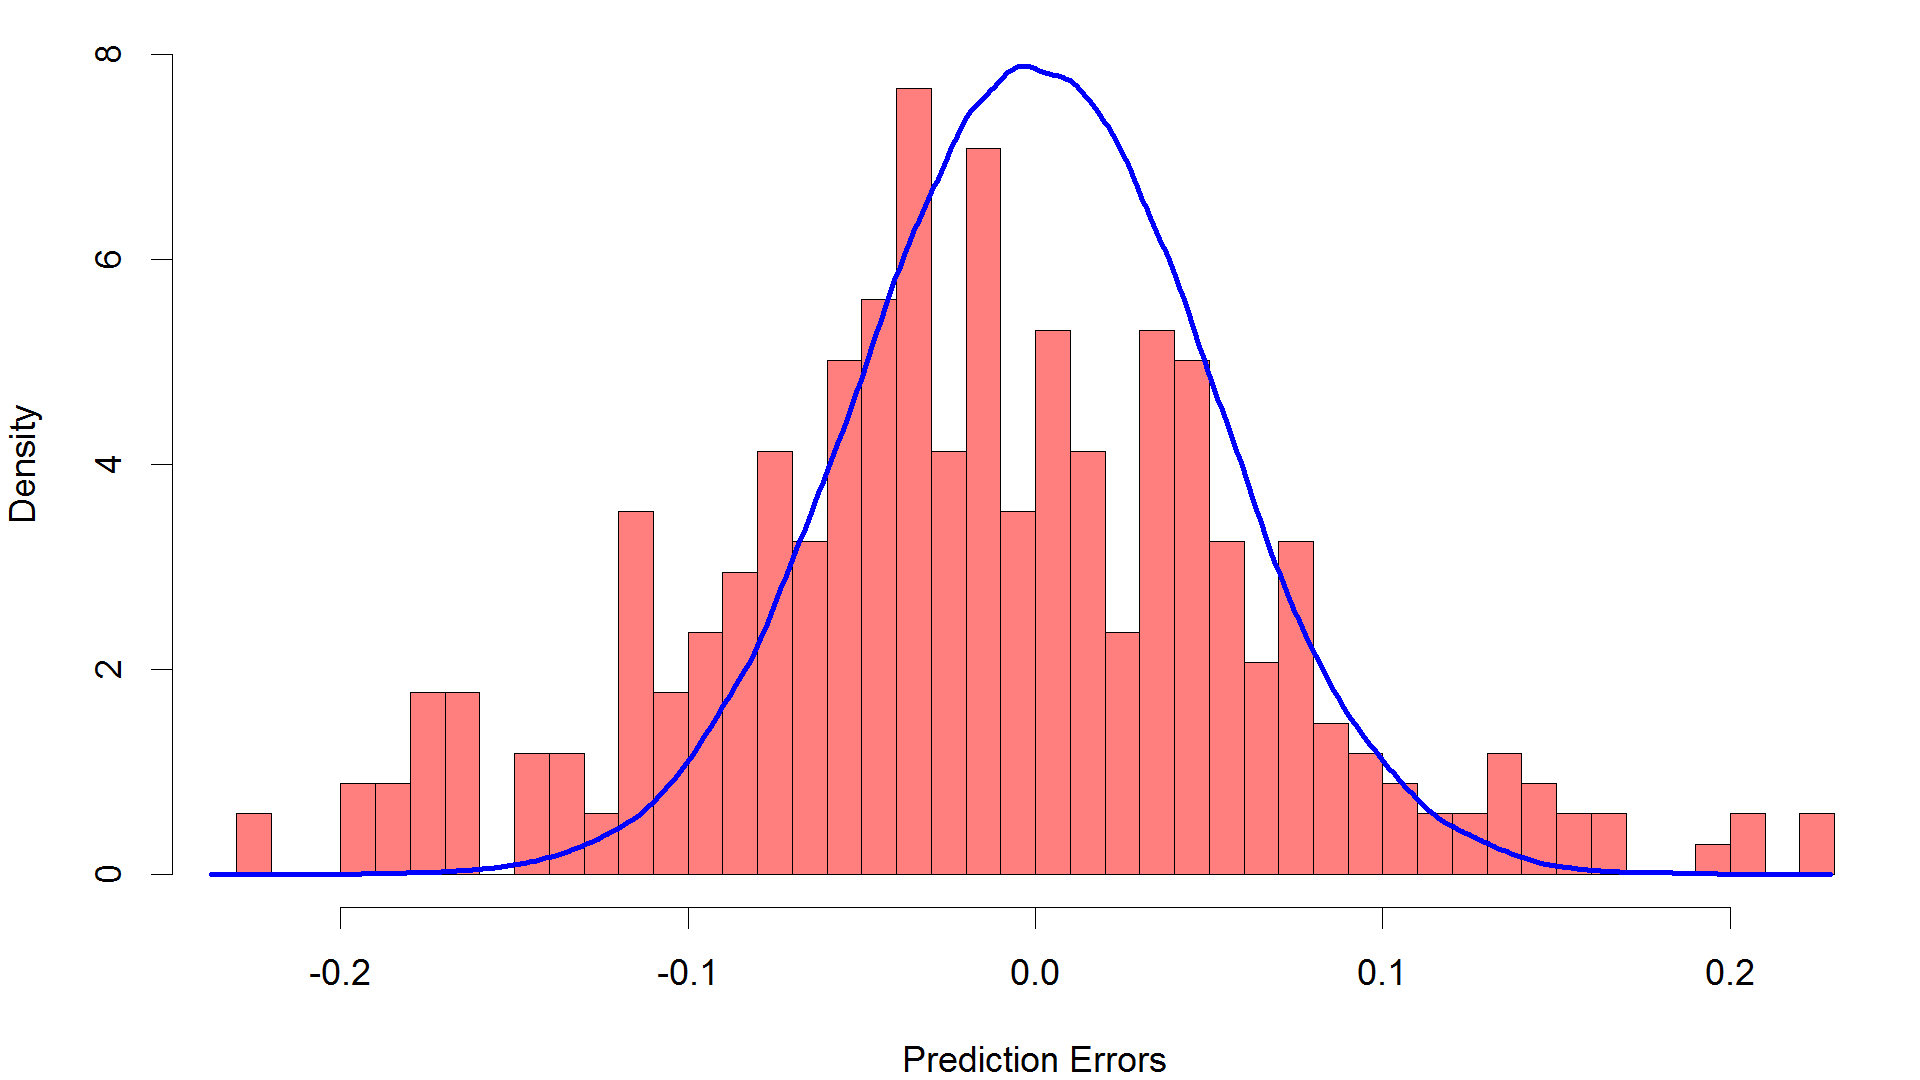
This graphic shows the spectrum of absolute prediction errors in 2014 (minimum of 200 PAs), using the consensus predictions (average of all prediction systems). Most errors fall within a reasonable range of 50 to 100 points of OPS, but there is a long tail of seriously missed projections. Granted, some of these players are aberrations, the recipients of gifts from the BABIP gods, or, on the flip side, snake-bit by injuries severe enough to impact their ability, but not severe enough to remove them from the field. But there are still some genuine projection errors lurking. Players like Victor Martinez, J.D. Martinez, and Michael Brantley seem to have made true steps forward. These players contribute the tail of the above graph. While there is a hazard to over-interpretation, it looks to me as though there are two kinds of prediction errors at work. Here’s another histogram of the real prediction errors scattered around 0 (a perfect prediction), to show you what I mean.
One is a standard, random process, the luck of BABIP combined with opponent quality variation and whatever else (which could be modeled as a normal distribution with mean 0 and standard deviation of .015 [blue curve]). And then there is a second kind of error, a sort of extreme event where a hitter’s ability changes for one reason or another, which would be completely unforeseeable under the first random process. Take Brantley, for example. The most bullish take on Brantley was provided by BaseballGuru, who prophesied a decent if unspectacular .751 OPS. In reality, Brantley got to .890, when all was said and done. The story is much the same with the other breakouts: Victor Martinez, predicted for an .800 OPS (by the usually over-optimistic fans), achieved .974, and so on. The astonishing fact is that not one but all of the systems missed on these players. While the details differ, projections are by and large similar to each other. When a player drastically over- or underperforms his projection, it’s not as though there is often one rogue system which foresaw it, while the others flopped. Accordingly, if you use the consensus projection of all nine prediction algorithms (instead of just a single one), it’s no more accurate (by any measure) than the best individual prediction algorithm. There’s no “wisdom of crowds” effect here which could help us predict the breakouts or breakdowns. Perhaps this fact shouldn’t be astonishing, in that all of the various projection systems fundamentally work with the same data (outcomes, as measured on a per-PA basis). According to James Surowiecki (who wrote the book on this), one element required for there to be a “wise crowd” is that there must be diversity of opinion. For the most part, all the current best projection systems are not very diverse. A corollary of this line of reasoning is that a new kind of prediction algorithm (one which relied on a different sort of data, or set up a different way), even if it wasn’t very accurate, could still be helpful if used in conjunction with one of these other sets of predictions. Simply by providing a different, more diverse take on the same players, the overall accuracy could potentially be improved. I’ll close with one last parcel of information that I find both surprising and encouraging. I was intrigued by a comment from Jared Cross, made at the Saber Seminar this year, about pitching projections. He noted that if you guessed a league average ERA for every pitcher in the league (a flat projection), you’d be right to within .95 runs, on average, while the very best current projection systems get to within .8 runs. I did the same analysis for hitters. With a league average guess for every hitter who got more than 200 PA last year, you’d get to within 120 points of the true OPS, on average. The projections, in contrast, range from within 80 to within 100 points of OPS, depending on the particular algorithm used. As with pitching, the projections are more accurate than randomness, but not by all that much. We’ll never be able to reduce the error of projections to zero (and that’s probably a good thing), but the ubiquity of breakouts suggests that we have at least some progress to make. *Full list: PECOTA, Cairo, CBS, Fangraphs Fan projections, Baseball Guru, Marcel, Oliver, Steamer, and Zips.
Robert Arthur is an author of Baseball Prospectus. Follow @No_Little_Plans
|
Did you find any commonality among the missed breakouts? Are they of similar ages, experience, batted ball profile, that kind of thing, or does it appear to be randomly distributed?
That's up next, as I gather more years of data. There's no obvious age pattern so far. I didn't check batted balls, but I will (and also other PitchF/X information).