


 14 comments have been left for this article.
 BP Comment Quick Links

|

|
November 11, 2014 Baseball TherapyIt's Not a Phase
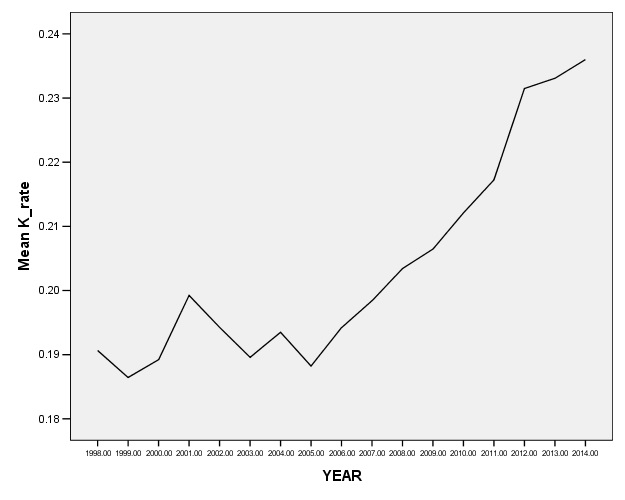
Now that the warm glow of watching Madison Bumgarner pitch the final five innings of Game Seven has faded (and the warm glow has faded from Madison Bumgarner’s arm), we can look back over the year that was 2014 and talk about a rather uncomfortable truth. Scoring was down again in baseball. This year, the average team scored 4.07 runs, down a tenth of a run from 2013, and hitting the lowest level since 1981 (a weird strike-shortened year). I suppose that whether a 3-2 game is more beautiful than a 10-9 game is a matter of personal taste, but it does lead to a rather challenging question. Will the 10-9 games ever come back? Scoring peaked in 2000, with teams scoring a gaudy 5.14 runs per game, meaning that since the turn of the century, scoring is down more than 20 percent. There are plenty of theories as to why this happened, most of them focusing on performance enhancing drugs. Once the PEDs were (mostly) kicked out of baseball, the air went out of the balloon. There are others who blame the expanding strike zone (although this is apparently starting to heal itself). And then there are those who blame Pitch F/X itself. There’s also the strain that blames infield shifting and the recent emphasis on defense in general. I can’t dismiss any of these claims out of hand, and they probably all contribute in their own way. But I’d also like to test a much less scandalous explanation. Things go in cycles. There is always a tension between teams allocating resources to hitting and to pitching, and a pull for the best athletes to specialize in one or the other. We are simply living in a time where that seesaw has fallen on the pitching side. What goes up must come down. There’s nothing to worry about. Is there? I believe you know what comes next. Warning! Gory Mathematical Details Ahead! Let’s talk about means and standard deviations. Suppose for a moment that what was really going on was a systemic effect. The strike zone really was expanding, indiscriminately. All pitchers benefitted from the new strike zone, to the tune of (pulling this number out of the air) a two percentage point increase in strikeouts. Everyone struck out two more batters per 100 faced. Well, of course, we’d see the league average strikeout rate go up, but if we looked at the spread in talent between players, that wouldn’t change. While Chris Sale and Mark Buehrle both get a bump up in their strikeout totals, the distance between the two (and between everyone else) doesn’t change. While the mean goes up, the standard deviation doesn’t change. It’s not likely that all hitters and pitchers are being affected by these systemic effects exactly equally. Even if the low strike really is being given more, there are some hitters who don’t care whether the ball is low or above his head. That guy’s going to swing. But still, if the argument is that there’s something systemic about the game that is changing, it’s likely that everyone is going to get some boost. Consider instead an alternate effect where hitters were either retiring or flunking out of MLB and being replaced by other hitters who turned out to not be as good. This is, in fact, one of the things that seems to be driving the strikeout epidemic in baseball. This would be a case of not enough good hitters being produced to replace the ones that leave, and so teams are forced to go with substandard ones. In that case, the league mean for offense would go down, but because more of the guys who are called up are below what used to be the average, it begins to shift the standard deviation as well. There would then be hitters who are so poor that in the past, they wouldn’t have been rosterable, but now they are the best of the dregs. The gap between the guys who are still around and the new guys is much wider. Let’s see what happens when we look at the league-wide mean and standard deviation for some important indicators. For my sample, I looked at 1998-2014 and took the top 30 players in plate appearances at each position. This eliminates the bench players and focuses only on the guys who, by definition, consume most of the plate appearances. Let’s start with strikeouts. The first graph is the mean strikeout rate. The second is the standard deviation among those 240 players in each year. The first graph shows that your average regular went from striking out about 15 percent of the time 10 years ago to striking out 19 percent of the time in 2014. The second graph shows that the standard deviation is going up as well.
So here, we have a pattern that suggests that more strikeout-prone hitters are coming into the league (or that some players already in the league are developing nasty strikeout habits.) So, perhaps we have a case where the spread in talent is getting wider? Well, not so fast. I’ve also found that one reason that strikeout rates are going up is that hitters are more likely to not swing until they’ve been fed a strike, and pitchers, seeing this, are obliging them. It could be that we’re seeing more hitters come into the league with this approach or more hitters adopting this approach. Probably a little bit of both. But let’s take a look at power numbers. Here are the means and standard deviations for home runs per PA. (For what it’s worth, the graph is basically the same for ISO as well.)
Again, we see the well-documented decline in home run rates. (So, guys aren’t selling out for power. They’re just selling out.) But the standard deviation is moving too. We’re seeing the standard deviation fall, meaning that players are getting homogenous. And bad. In fact, the same basic pattern appears for OBP and walk rate as well. The disease seems to be affecting everyone. The only thing that hitters seem to excel at any more is striking out. But let’s take a look at this from the pitcher’s side as well. I took the 150 pitchers who logged the most innings as starters from each year (again, 1998-2014). This time, the graphs tell a somewhat different story. Here are the graphs for strikeout rate for pitchers. Again, we see the mean first, then the standard deviation, graphed over time. And again, we see the mean going up over the past decade, but in the standard deviation graph, we actually see relatively little movement, and no discernible trend line. It suggests that all starters are getting a bump upward in their strikeout rates. Bully for them!
In fact, the rest of the graphs tell a similar story. Walk and home run rates, ISO against, and OBP against are all falling, but the standard deviation graph shows relatively little movement. I did the same analyses for relievers (the 150 pitchers who threw the most relief innings in each year). Again, we see strikeout rates going up in general for relievers, and in this case, upward movement in the standard deviation. We’re seeing more relievers who are extreme strikeout specialists (hi there, Aroldis Chapman), so that’s not surprising.
But, like with the starters, we see the other offensive indicators trending downward for relievers, which they are of course happy about, but again, limited and seemingly random movement in the standard deviation. Here are the graphs for home run rate. (Again, they all look basically like this.)
I briefly considered that maybe teams were consciously allowing offense to fall by the wayside a little bit because they were emphasizing players who specialized in defense. There are cases of that, but looking at BABIP from 1998 to 2013, we see that BABIP has gone up and down a bit, but again, with no discernible pattern. If teams are trying to sacrifice offense for defense, in the aggregate, they’re not doing a great job.
The evidence also suggests that teams have not actually been prioritizing pitching over hitting. Here’s a graph of the percentage of picks in the first five rounds of the Rule 4 (June Amateur) draft who were pitchers in each year. If anything, the drafts which are now bearing their fruit at the MLB level were actually trending downward in terms of grabbing arms rather than bats.
There’s also no evidence that teams have been systematically paying more bonus money to pitchers (or were back during the drafts that are now populating the MLB rosters).
After looking at the evidence, I think the conclusion to be drawn is that baseball is not in the middle of a mild cyclical hitting drought. There’s a real structural change about how the game is being played and it’s bringing scoring down. Looking for a Culprit The strikeout scourge probably has to do with the expanding strike zone and overly patient hitters. Maybe PITCHf/x has made preparing to exploit an opponent’s weakness easier and perhaps pitchers have the upper hand there as well. It’s not clear from these data whether PED (or more to the point, a lack of PEDs) are a co-conspirator. The power outage that the game is experiencing might be due to the fact that everyone’s so busy striking out. Or maybe they’re striking out more because pitchers aren’t afraid to challenge them any more. It’s hard to tell. But what’s clear is that getting the offense back in the game–if that’s what MLB wants to do–is going to take an active step. If there really is some fundamental way in which the game has changed, then someone’s going to either have to change it back or make some counter-move. But waiting around probably won’t do much.
Russell A. Carleton is an author of Baseball Prospectus. Follow @pizzacutter4
|
Could there be an effect that advances in sports medicine have benefitted pitchers more than hitters? The hitting motion by itself rarely produces injuries (the occasional oblique strain being the exception). Pitching is by itself an injury indicator. Mechanical adjustments based on advanced motion analysis and surgical interventions that get pitchers back out sooner and with little effect on quality (viz Tommy John surgeries) may have, in effect, broadened the pool of good available pitchers, while hitters have seen no comparable benefit. (Plus, perhaps, the efficacy of pitching medicine means pitchers are less afraid to really air it out all the time.) Just speculating, but the factor seems plausible to me.
That's a reasonable hypothesis, although I'm not sure that DL use is actually down or that recovery times are down or that pitchers don't lose as much mojo after. I'd have to check.