 This is showing fastball frequency as a function of the month, with the gray line dividing the first half of the season from the second, and the red circles showing the mean fastball frequency for each half. The difference was minor in magnitude, but also sufficiently large to be statistically significant. Whole teams don’t often see a concerted change in approach of that degree, suggesting that there was something strategic to the opposing teams’ new attack.
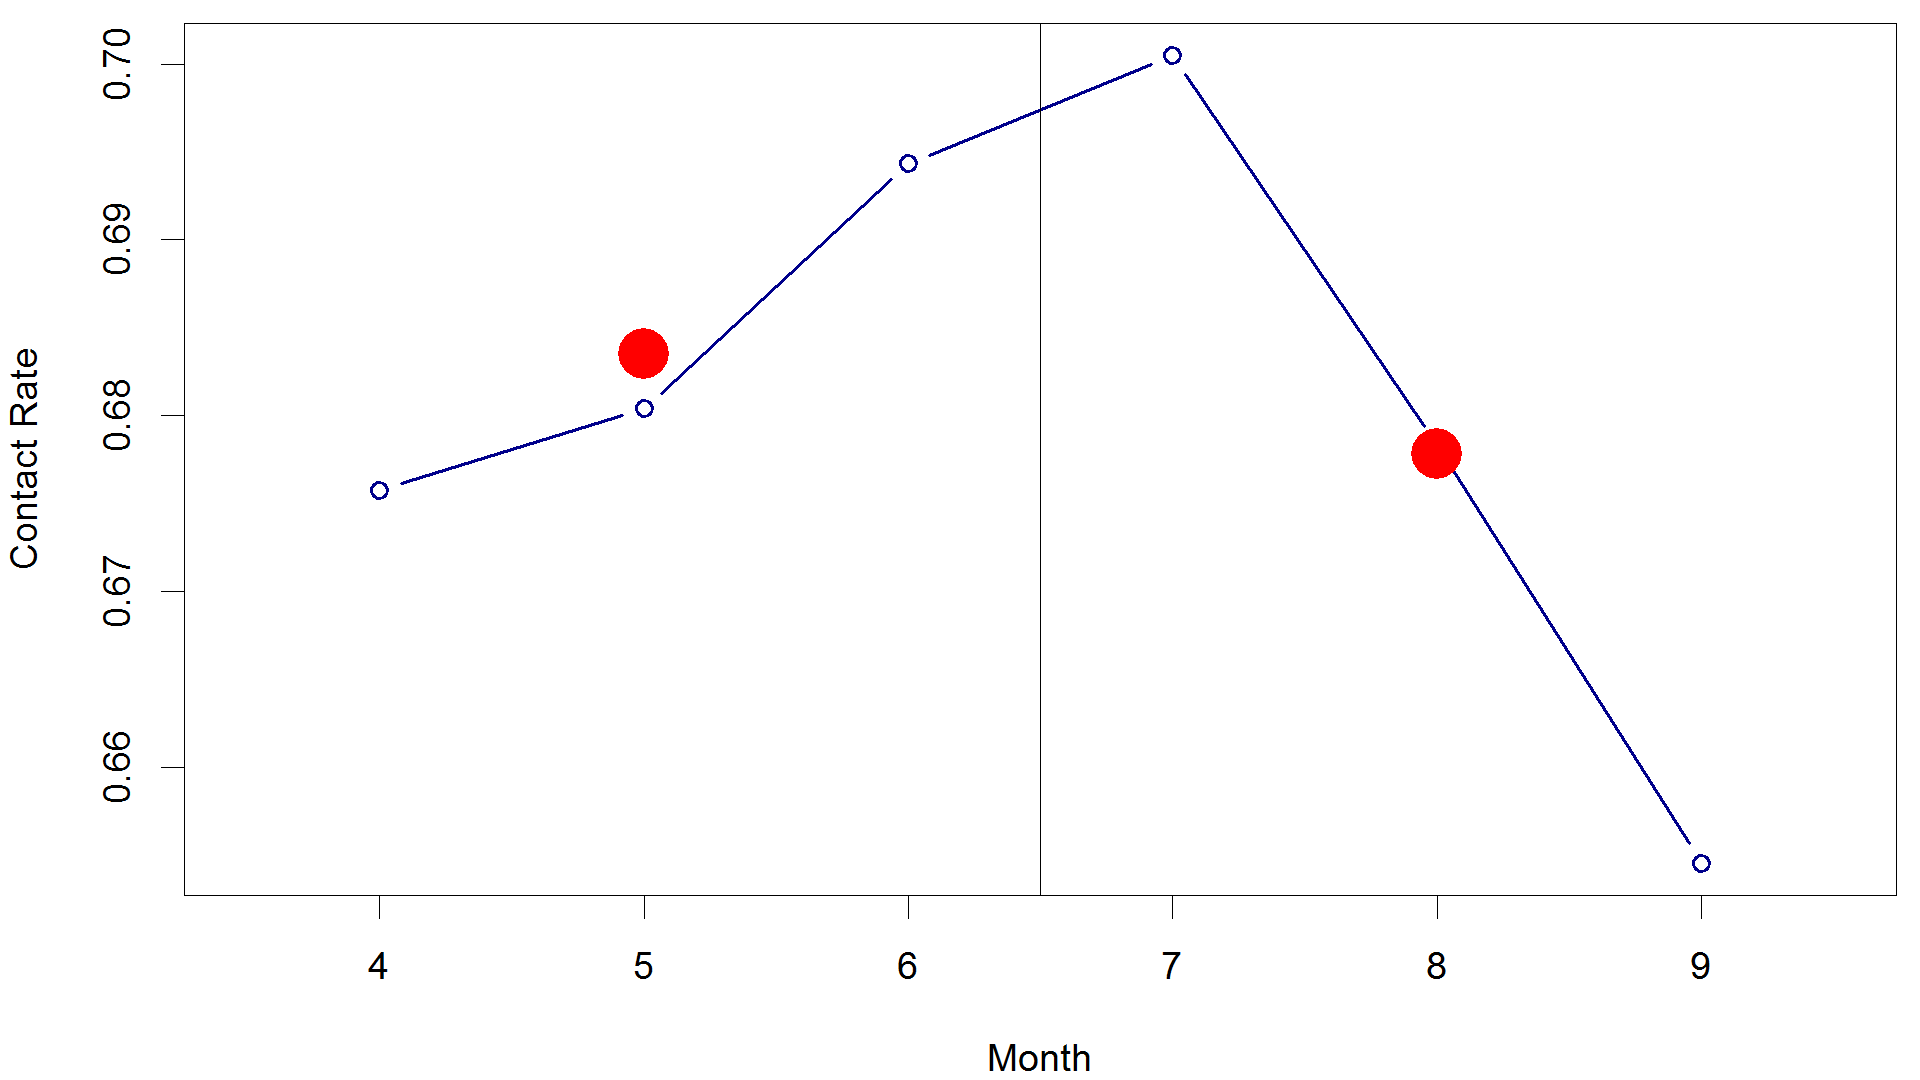 While the rough outlines of Ken’s prediction hold up, the difference is relatively small (<1%). Moreover, the month in which the A’s saw the fewest fastballs actually had the highest in-zone contact rate. The pattern is there, but somewhat muted.
 His rate didn’t fall too much between halves, at least on an average basis. But August and September saw below average contact rates.
 Here’s where you see a really significant increase. League average foul rate, according to the way I’m calculating it and for these pitches, comes in around 29 percent; so you can see that for the latter half of the season, Moss was fouling balls off 20-30 percent more often than league average. We usually think of fouls as a rather innocuous and unpredictable play, but if pitchers knew that they could induce fouls from Moss in early counts by throwing high heat, they would have taken advantage of that pattern to push Moss into pitcher’s counts, where breaking balls could be unleashed with ease (and increased frequency).
 This graph is a solid win for Ken’s hypothesis. The swing rate on out-of-zone breaking balls was up about 2 percentage points in the latter half of the season, and even more than that in the two months in which the A’s hitters struggled the most (July and August). At their best and most successful, the A’s would swing at less than 32 percent of the breaking pitches outside the zone, and so they would see about 3.9 to 4 pitches per plate appearance. In their more aggressive, less discriminating July, they were seeing only 3.7 pitches per plate appearance.
 Here, his swing rate against out-of-zone breaking balls (as a proportion of his total swings) increased substantially in the second half, which might have been both a cause and consequence of his slump.
 The overall pattern of changes is beautifully consistent with Ken’s theory, not to mention Brandon Moss’ own words.
 7 comments have been left for this article.
 BP Comment Quick Links

|

|
October 8, 2014 MoonshotFastballs and the Collapsing A's, Part 2
In last week’s column, I shared an observation I’d made about the pitch selection used against the Oakland Athletics. I found that sometime midway through the season, opposing pitchers had subtly but noticeably altered the frequency at which they threw fastballs. Suddenly, the Oakland A’s were being approached with a reduced number of heaters*:
The problem was that I couldn’t figure out what that something was. There was no obvious weakness in the A’s hitters against breaking balls, or particular strength against fastballs. However, as I noted last week, our tools for establishing pitch values are painfully simple, especially compared to the complexity inherent in the batter-pitcher matchup. Part of my objective in writing last week was to throw this observation out to BP’s wonderful readership (i.e. you), since you are by and large discerning and savvy viewers of the game. Astute reader (and sometimes writer) of BP Ken Arneson had a particularly intriguing response, suggesting the following explanation for the A’s fastball decrease:
I thought this was a fascinating interpretation, and a few other Oakland fans and observers independently agreed. So I decided to try to test this hypothesis, which Ken narrowed down to two specific predictions:
Let’s go to the data and see if it supports Ken’s idea.
1. Contact rate on fastballs in the zone went down
We can look at some individual players, such as Brandon Moss. Brandon Moss went through a terrible slump midseason, which reached its nadir late in the season with OPSs of .548 and .613 in August and September, respectively. Glancing at his contact rate, we can see a signal of that slump:
Moss is quite saber-literate and had fascinating things to say in a September interview with Eno Sarris:
Moss explains that due to the nature of his unique swing path, he is prone to chasing—and then fouling—pitches up in the zone, especially during slumps when his confidence is shaken. Accordingly, I took a look at his foul rate in the zone against fastballs, as well (which Ken also suggested).
I’m calling this a partial win for Ken’s theory. Strictly speaking, contact rate is down, albeit probably not in a statistically robust way. But couple that with the increased foul rate, and the evidence is consistent with what Ken suggests. No player shows a really huge decrease in in-zone contact rate, but most A’s showed some decrease (including Josh Donaldson), and the fouls are also consistent with Moss’ own words.
2. Swing rate on non-fastballs out of the zone goes up
Now, granted, swing rate at those out of zone breaking pitches didn’t increase for every hitter. Brandon Moss was actually swinging a little bit less often, for example. But part of that is that Moss was just swinging less, period—a change he made consciously. If you quantify the swing rate against out of zone breaking balls relative to the overall swing rate, a different pattern emerges:
If you make the same adjustment to Oakland’s total swing rate against the breaking ball, the difference becomes more stark between halves:
To recap: several of the Oakland hitters became injured or went through slumps in the second half. In order to compensate, they started looking to swing early at fastballs, with which they were having trouble making consistent contact. In exchange for a little increased speed on the fastball, they traded off pitch recognition, which caused them to swing a bit more aggressively at breaking pitches outside the zone. In addition, Brandon Moss became more vulnerable to the high fastball, which he fouls off with some regularity. In total, the Oakland hitters fell apart, and the simultaneous slumping of some of their best weapons (Donaldson and Moss, in particular) was the undoing of their offensive production. Of course, I don’t mean to imply that this is the only possible explanation for their second-half problems. It could always be (very coincidental) random variation. But with that said, all the evidence gathered so far is consistent with the hypothesis Ken advanced, as well as the concerted change in pitching strategy I found earlier. Assuming the scenario I outline above is true, Oakland’s offensive demise raises some interesting questions. To start, I wonder how often hitters are dealing with lingering injuries, and whether they often make adjustments to their approach in order to handle fastballs, in the manner which Ken suggested. If these kinds of adjustments are common, perhaps we can perceive them in real time, by looking at patterns of swinging and fouling. A bigger, perhaps philosophical question, is why Oakland’s struggles were so visible in the PITCHf/x record. One possible explanation is the strong similarity of Oakland’s core group of hitters to each other. Many of Oakland’s best sluggers are fly-ball heavy, with strong plate discipline skills. These aren’t negative traits, per se. But when an entire lineup is made of one type of hitter, perhaps the entire lineup is prone to a particular approach by opposing pitchers (which may itself be a weakness). If nothing else, it makes that approach vividly accessible in the Pitchf/x data. More painfully for A’s fans, it looks as though Oakland was recovering from their teamwide malaise in September. Some of the trends I outlined look as though they were reversing themselves, and we saw them suffer through an absurdly unlucky stretch of one-run losses. There was the potential for an offensive reversal at precisely the right time, but it wasn’t enough. At least Oakland fans can comfort themselves with the knowledge that they lost to what appears to be this year’s team of destiny, the Kansas City Royals. At least Oakland fans didn’t have to suffer the ultimate ignominy of Billy Butler stealing a base against their team to seal a sweep.
Thanks to Pitch Info for the pitch tags used in this research; Rob McQuown for some assistance; and the readers/commenters, especially Ken Arneson, for pointing out interesting directions to look into. *Numbers are slightly different from last time because I’m using pitch tags from Pitch Info, instead of the MLBAM classifications. While there are differences month to month, both datasets agree that fastball frequency declined about 2 percentage points between the first and second halves.
Robert Arthur is an author of Baseball Prospectus. Follow @No_Little_Plans
|
Why the gratuitous hit mocking Billy Butler when he is completely irrelevant to this story?
Even if it was meant to be tongue-in-cheek, Butler should instead be applauded for risking to extend himsellf to overcome his innate limitations.
After all, bullies always act as if it will get them off the hook if they claim they were "just playing around."
That was not a knock on Billy Butler, who should be lauded for the steal, as well as his baseball smarts and awareness (I literally did applaud him, sitting in my chair, as it happened). That was a knock on the Los Angeles Angels of Anaheim, who gave Billy Butler a chance to steal.
I guess you could say I'm bullying the Angels, but I strongly suspect that they don't care, and/or would admit that allowing Butler to steal was pretty boneheaded.
Finally, it was relevant to the story as an unusual happening which exemplifies the randomness of the postseason. Perhaps that connection was not clear. I certainly hope I did not offend either Billy Butler or any of the Angels.
The Angels are reading this and thinking what a jerk you are. The Angles care very much, Robert.
As do the Angels.