

 23 comments have been left for this article.
 BP Comment Quick Links

|

|
October 2, 2014 MoonshotFastballs and the Collapsing A's
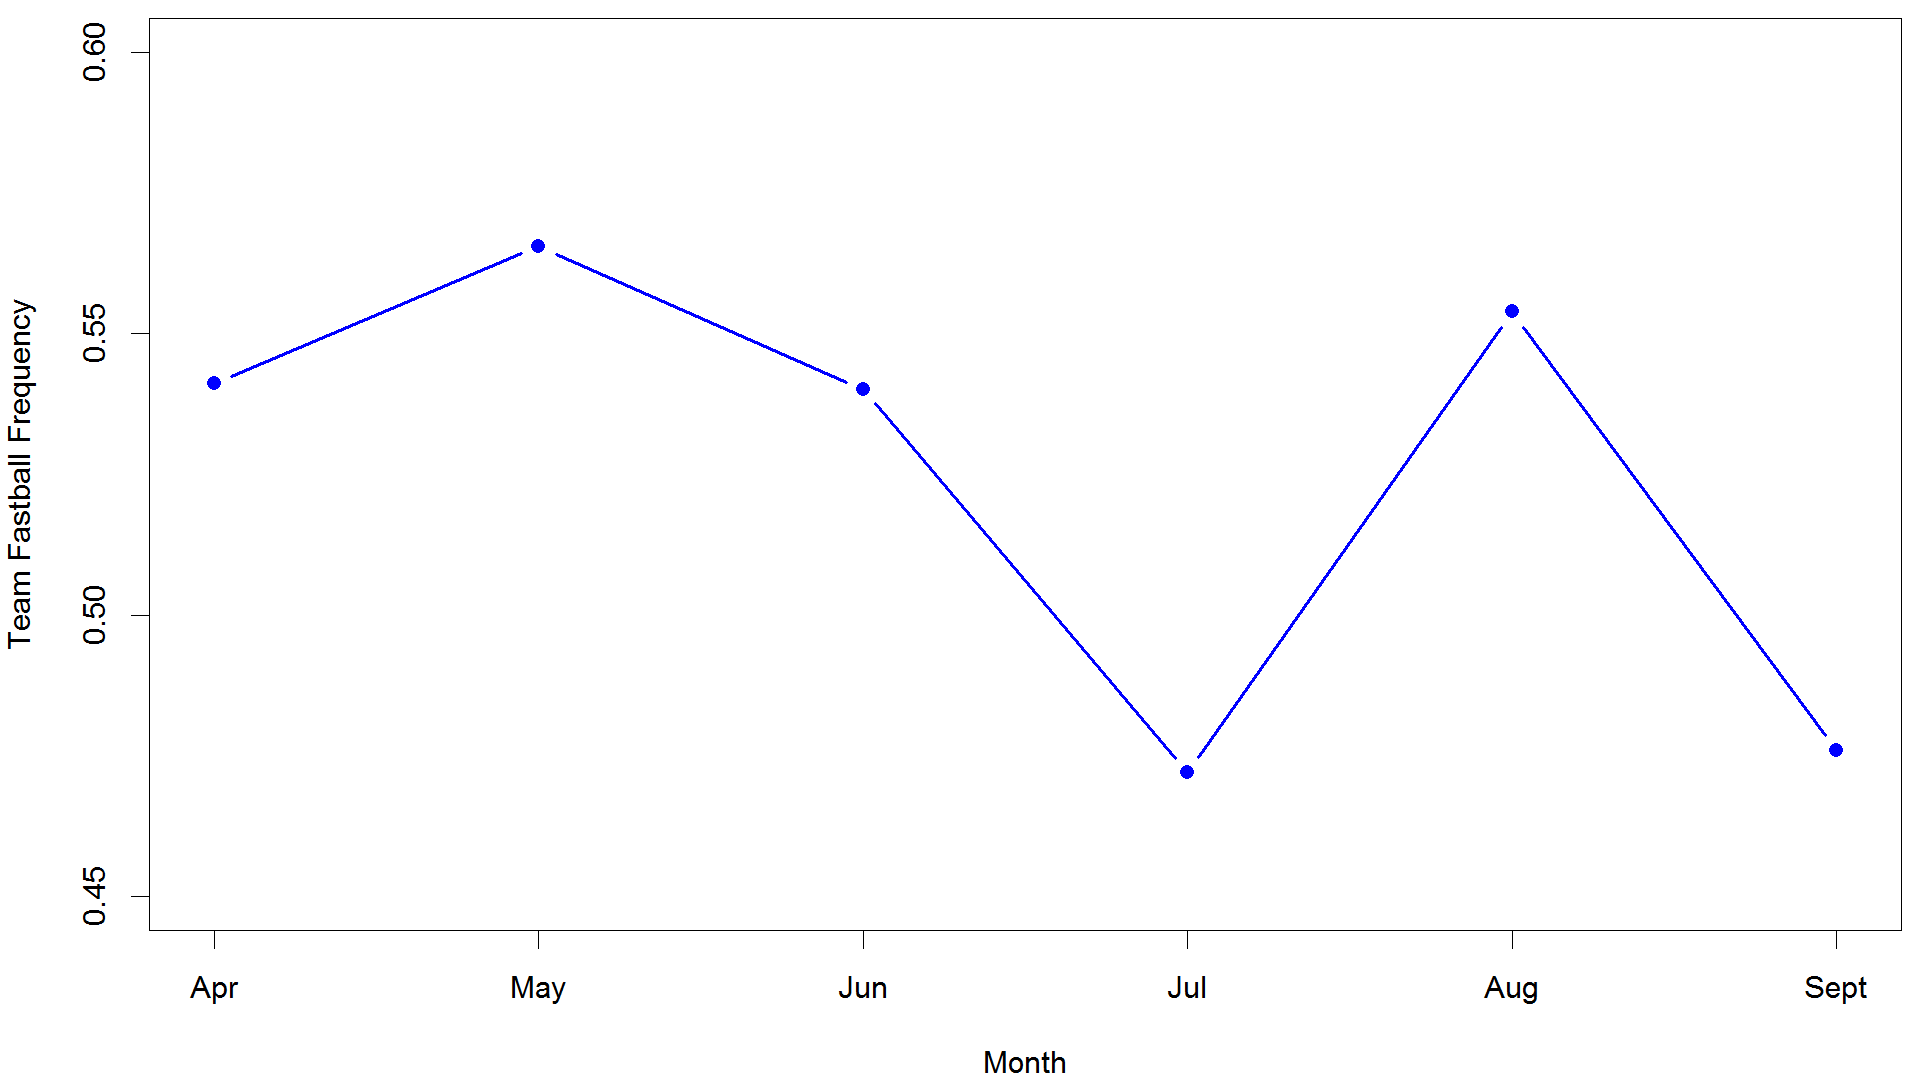
The Oakland Athletics completed their second-half collapse in true Oakland fashion by failing somehow to advance in the postseason against the Royals. For a season in which Beane went all-in by trading future potential for current performance, in which the A’s began the year an unstoppable, historic juggernaut, the inglorious ending has to smart. The A’s of this year embodied one of the most beloved playoff myths, that the second half of a team’s performance predicts how that team will do in the playoffs. I say “myth” because, at least in the aggregate, there is little or no evidence in support of this idea, and so it has been debunked on numerous occasions. And yet, there may not be a better example of that phenomenon in action than this team, which roared out to an incredible start to the season, on pace to challenge run-differential records, only to buckle in the second half, barely making the playoffs. My intuition wants me to believe that the A’s collapse was inevitable somehow. It’s frustrating to look at a team like the A’s, made cleverly and on a shoe-string budget by a sabermetric hero, failing for no other reason than six inches of Josh Donaldson's positioning and tremendously poor injury luck. Naturally, I want a reason, some scapegoat, or at least a clue, as to why these promising A’s folded so readily. Whatever the ultimate cause, Oakland’s collapse is primarily on the offense, whose production fell by something like a run and a half in the second half of the season. The Oakland lineup is loaded with potent hitters, and it made no sense for them to fizzle. One can’t predict ball. I should note here that the offense performed perfectly capably in the wild-card game, putting up eight runs against the excellent combination of James Shields and the KC bullpen (with a special guest appearance by Yordano Ventura). For a night, whatever offensive struggles ailed them were less of a concern than Jon Lester’s inability to throw over to first and Ned Yost’s Retro Small-Ball Attack. Even so, Oakland never would have had to be in the wildcard play-in if their hitters had kept up their performance in the first half, so I’ll focus here on that offense. There might be a clue to the Oakland breakdown in the approach pitchers used against them as the year went on. Pitch selection is one element of the overall approach, and while different pitchers may possess different repertoires, we can roughly divide all pitches into fastballs and not-fastballs. Generally, players who see fewer fastballs are younger and drive pitches with more authority. Conversely, players who see more fastballs are older and less powerful. The league average fastball percentage is about 55 percent. For the first three months of the 2014 season, Oakland’s core group of regulars maintained a fastball percentage of 54.1 percent, just a smidge under the average. The group had good power (SLG’s of .412, .421, .383 by month) and plate discipline, and it wasn’t on some fluky BABIP (.298, .265, .301). Everything was going well and in the proper order. Then, something weird happened. Pitchers started throwing the Oakland A’s many fewer fastballs.
Charting the frequency of fastballs by month, you can see Oakland bouncing around in the normal zone of ~.55 in the first three months of the season. July rolls around, and abruptly, fastball frequency falls 8 points. It recovered to a reasonable level in August, but went back to the bottom in September. Overall, the fastball frequency of the A’s hitters in the first three months of the season was 54.1 percent, and in the last three months, 52.2 percent. It’s not a tremendous decrease, but keep in mind that we’re looking at thousands of pooled pitches, and that the numbers are aggregated across hitters. If you look at individual A’s hitters, the differences get even more pronounced.
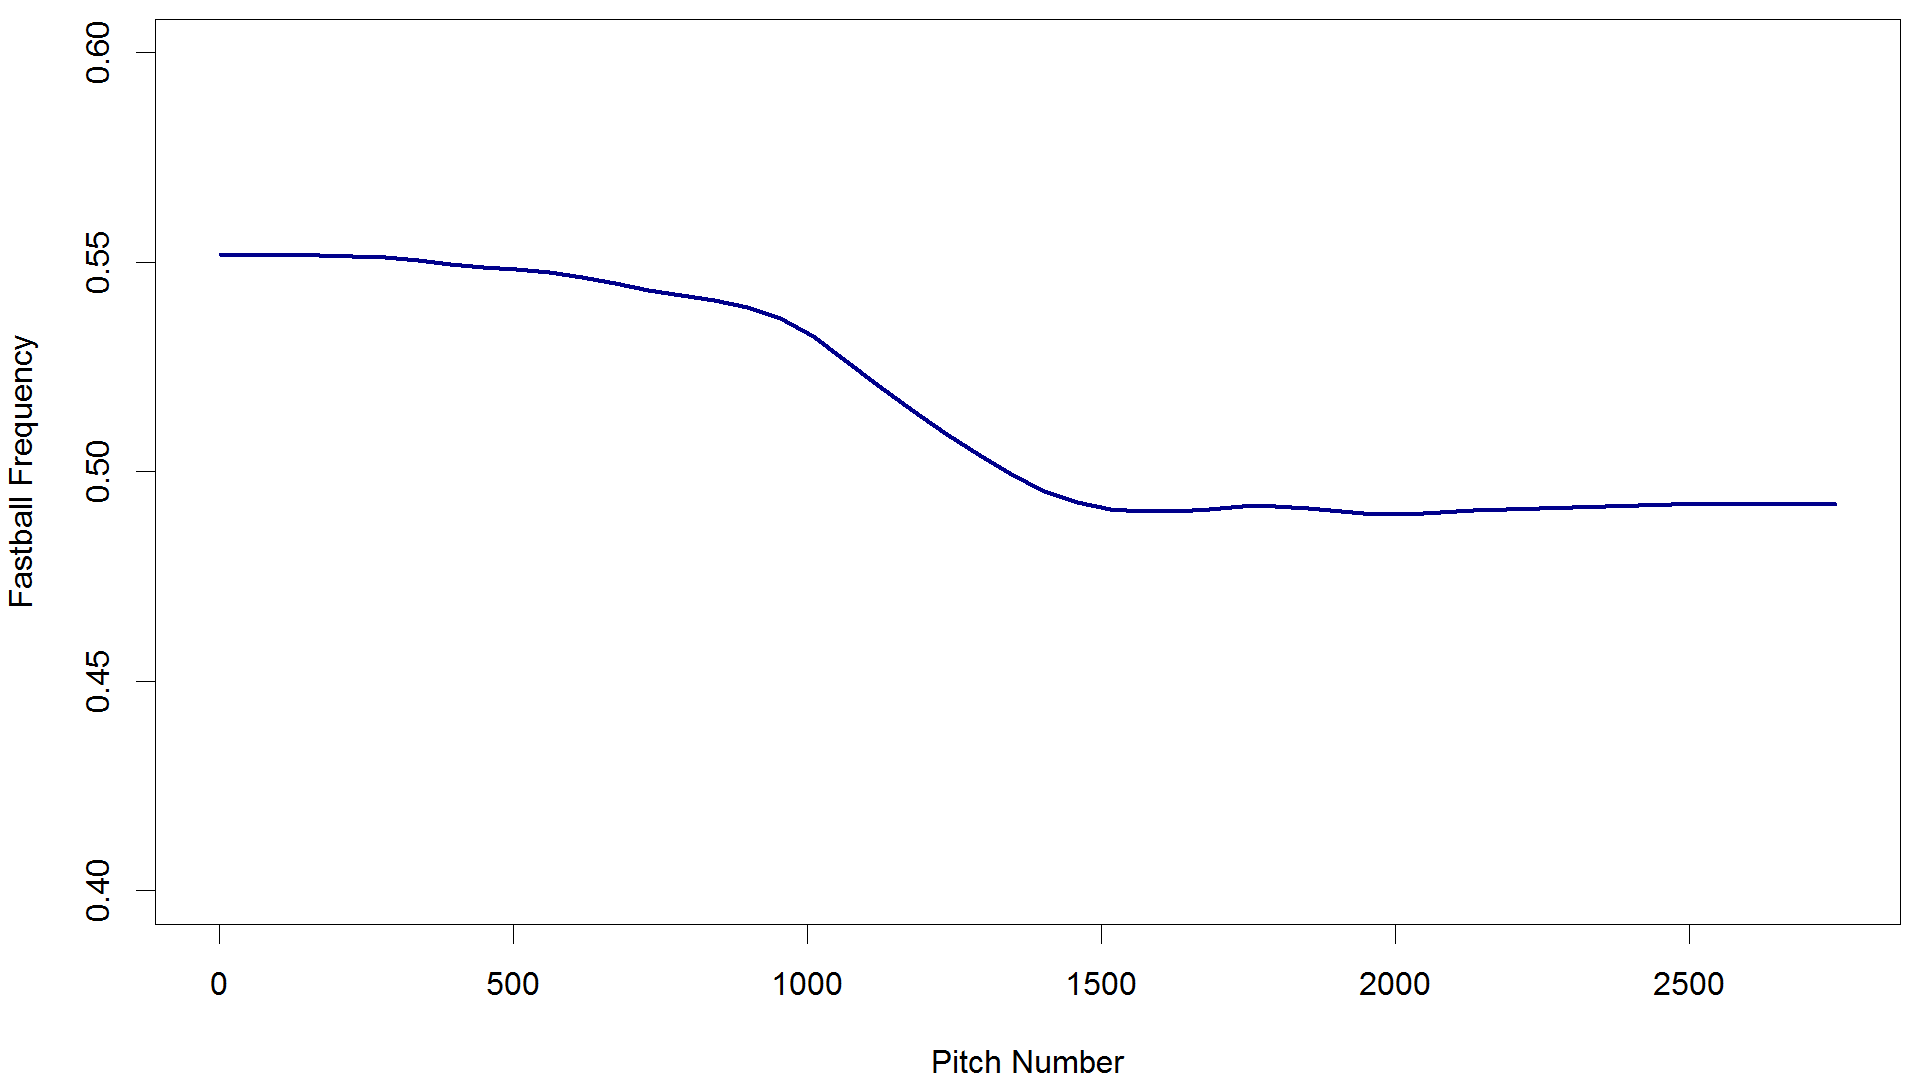
From June on, all but Alberto Callaspo (black line with blue points) saw their frequencies drop radically, some by more than 10 percentage points. Josh Donaldson, for example (LOESS smoothed trend):
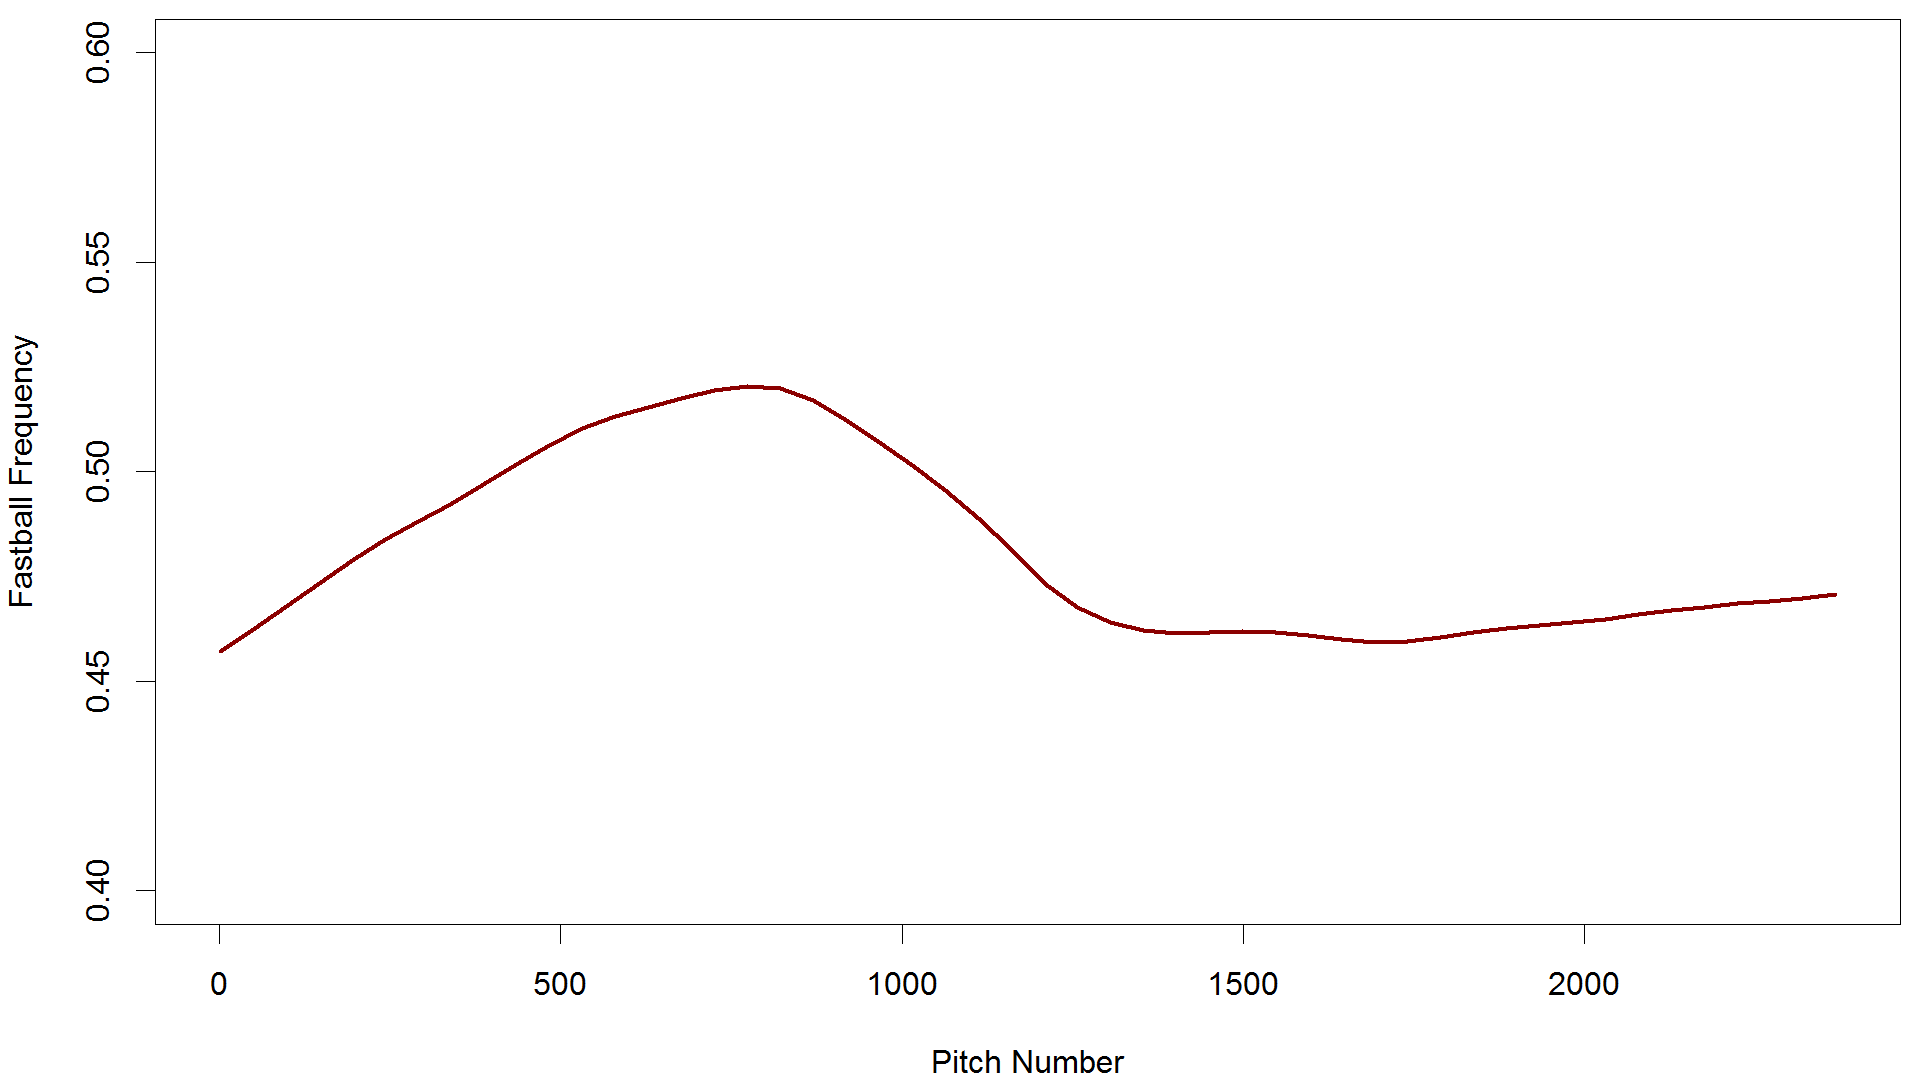
Or Brandon Moss:
Even a player who left the team midseason, Yoenis Cespedes, sees his fastball frequency drop like a stone:
The difference is sufficiently dramatic on the team level that it’s unlikely to have occurred by pure chance alone. If you draw a set of simulated lineups at random from players across the league, and ask how often these simulated lineups dropped as much fastball frequency as the A’s did, you find that it never happens. In other words, the drop in fastball propensity is to a statistically significant degree. It’s not as though they faced fastball-happy hurlers in the first half and fastball-phobic throwers in the second. If you look at the pitchers the A’s faced in the first and second halves and ask how many fastballs they threw, there’s no difference. So as far as the pitchers who went up against the A’s, there was no predilection for the second-half hurlers to avoid the fastball against non-Oakland teams. You may be wondering whether the drop off in fastball frequency might be related to the loss of one Yoenis Cespedes, slugger of some repute. Others have advanced the argument that Cespedes was somehow the linchpin of the Oakland offense, the crucial hitter whose presence enabled the rest of the batting order to perform optimally. Perhaps I’ve simply re-discovered lineup protection, and really the whole time Cespedes was setting up his teammates with fastballs. That doesn’t appear to be the case, however; the timing doesn’t fit. The A’s fastball frequencies started their descent in July, when Cespedes was still on the team (he was traded on July 31st). It did continue in Cespedes’ absence, but it started before he left. In addition, I usually think of lineup protection as altering the location of pitches more than their pitch types. I looked at the zone distance of all the pitches the A’s saw in the first and second halves, which is a proxy for how feared the A’s hitters were by opposing pitchers. There was no meaningful difference between halves. Zone distance did fall, but by only a tenth of an inch, which hardly seems enough to explain the A’s offensive blues. Here’s the part where, ideally, we’d like to interpret what the decrease in fastball frequency means. The trouble is I’m not really sure how to do that. One might presume that the opposing teams chose rationally to decrease their fastball frequency because they thought that either 1) Oakland was doing especially well against fastballs or 2) Oakland was doing especially poorly against non-fastballs. However, perusing stats by pitch type doesn’t portray the Oakland hitters as feasting on the fastball or, conversely, being lost against breakers. Oakland did do well against all types of fastballs, but good-hitting teams generally do well against fastballs, or else they wouldn’t be so good. A major caveat, however, is that breaking up outcomes by pitch type is unreliable and difficult. Since pitches play off each other in complex ways, a pitch which on the surface looks like a negative outcome may set up a weak groundout in the next throw. More broadly, it may be that the A’s truly struggle against curveballs and sliders, but in a way which doesn’t manifest obviously in the statistics. That’s an area crying out for further research and follow-up. I can say confidently that the A’s saw a vastly decreased fastball frequency, and that it seems concerted and consistent enough to be a non-random difference. In other words, this change in approach looks like a calculated maneuver on the part of the opposing teams. But why they employed this shift is anybody’s guess. In a way, analysts of baseball are often stuck picking up the breadcrumbs that the teams leave behind in PITCHf/x or other datasets. It looks like there’s a trail here somehow. That drop in fastball frequency looks deliberate enough to be a plan of attack, one which teams adopted against the A’s, and maybe that says something about the frailty of their first half success. On the other hand, maybe I just spent enough time and energy looking for an explanation where there isn’t one that I succeeded in finding a statistically improbable oddity. The trouble with intuition is that sometimes things really do happen just by chance.
Robert Arthur is an author of Baseball Prospectus. Follow @No_Little_Plans
|
Interesting observations made here. I'm wondering if this is some kind of reaction to improving pitch counts against Oakland. I would expect that the raw pitch counts per PA would drop as FB frequency increases, so that may not be particularly useful in finding an explanation.
However, were the A's particularly good at working pitchers into deep counts (relative to league average) in the first half of the season? If so, perhaps they were good at exploiting those 3-0 or 3-1 offerings (thus having an above average BA against deep count offerings). To mitigate that, perhaps teams realized getting ahead of them earlier in the AB would be of greater benefit (thus an increase in FB usage). Looking at data for pitches/PA and team performance in deep counts might shed some additional light on this.
Good point. One possible causal chain: A's hitters perform worse --> Underperforming hitters get into worse batting counts --> Worse batting counts lead to a lower pct. of fastballs. That seems more reasonable than a league-wide effort to throw more breaking pitches in the second half.
There's not a big correlation between overall offensive performance by TAv/OPS and fastball percentage. But it's a reasonable suggestion to look into in more detail. Parsing fastball % by count before and after seems like a good next step (as well as looking at swing rate).