


 38 comments have been left for this article.
 BP Comment Quick Links

|

|
August 20, 2014 MoonshotThe Analytic Value of the Crack of the BatBaseball is possessed of a rich and diverse collection of sounds. The shouting of the fans, their intermittent applause and jeers, and the crackling of the PA system all contribute to the cornucopia. Even limiting ourselves to the action on the field, baseball is aurally pleasing: the pulse of the ball pushing the air out of a glove, for instance. First among all baseball sounds, without question, is the crack of the bat. Something about the whip striking the ball is downright electric. If you are like me, after watching so many thousands of baseball games, that crack still exercises a visceral and jolting effect on my nervous system. It is baseball’s leverage alarm: the contact could result in a routine groundout, or it could be a massive home run, but either way, the stakes just increased and you’d better pay attention to what happens next. Yet the crack of the bat is itself diverse. Some balls are ripped with great force, and produce a crisp, single note. Others are walloped into the ground, off the bottom of the bat, and generate a dull thud. Some players routinely seem able to contact the ball with the kind of sound that is associated with hits, regardless of whether their screaming line drives find gloves. I think many a sabermetrically-inclined fan of the game has wondered about measuring those sounds. Not that our ears are a bad guide, but human perception is subjective and can be biased. It would be interesting to know, for example, if your favorite player’s bat really does produce a special sound, or if you can tell the difference between a home run and a groundout based only on the crack. Collecting sound data itself is not very difficult. To do so, I used my computer to directly record the sound feed from MLB.tv*. When you collect sound data, you can see a direct readout of it that looks like this:
Time is passing on the x-axis, and the y-axis relates the amplitude of the sound that’s being recorded. Loud sounds produce more significant departures from the line at 0, which represents silence. The first task was to see whether the crack of the bat could be at all distinguished by the computer from the surrounding sounds. That turns out to be trivial, for two reasons.
The first reason is that the sound of the bat is extremely loud relative to the rest of the television feed. The second reason is that the sound is also very short. The combination of these characteristics gives us that crisp, sharp sensation which is so pleasing to the ear (and attention-grabbing). Having now convinced myself that I could reliably identify the sound of the bat in the audio feed, I wanted to do a more detailed analysis of that sound. I first needed to gather a bunch of bat cracks. To do so, I used the condensed games feature on MLB.tv, which turned out to be ideal for this purpose. The condensed games strip out the announcers’ feed, leaving you with the sound of the game as it happens on the field. I collected several games worth of audio, saving individual audio files for each contact event, and noting the result of that contact in broad terms (fly out, groundout, home run, etc.). The result of that work was a small sample (5-10) of each event variety. Before I get to the #GoryMath, let’s listen to that most glorious of sports sounds, the bat crack. For each event, I made a composite sound of that event by stacking all of the bat cracks on top of each other to produce a sort of ‘average’ sound. This, for example, is a composite home run, made from eight separate dingers:
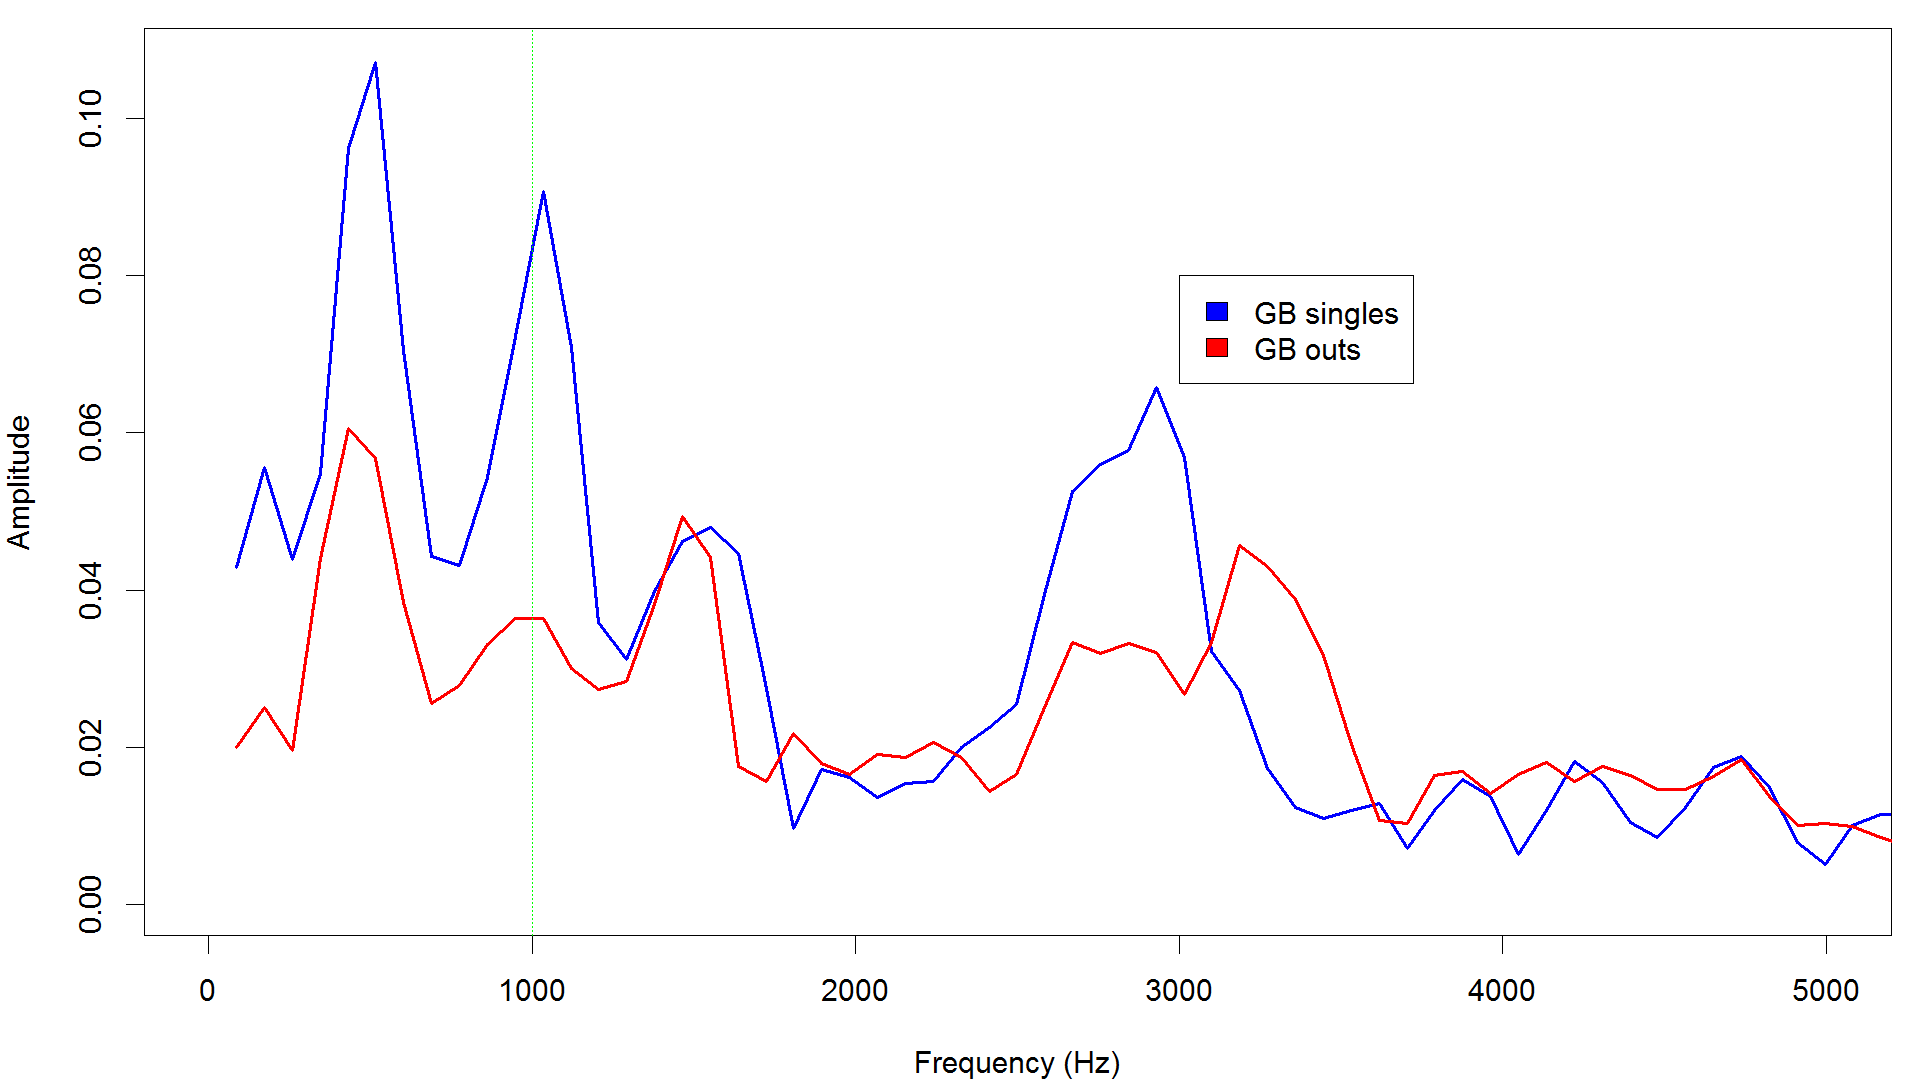
This is a composite groundout (n=9): Here’s a composite line drive (n=10): Those are three different kinds of batted balls that all sound relatively distinct to me, but we can make deeper distinctions than that. Consider the sound of a composite groundout (above), relative to the sound of some grounders which went for singles (n=6). Side by side, it’s easy to hear that the groundball singles were slightly higher-pitched. On the other hand, contrast a bunch of fly outs (n=7) with the home runs. I don’t hear much difference there at all, although your ears may vary. With the exception of home runs and fly balls, most of those sounds seem quite distinct to me, which suggests that there are some real differences in acoustic characteristics between them. Sound is actually waves of air pressure. To collect data on it, one is really collecting a series of air pressure measurements (usually 44,100 per second). Loud sounds produce greater increases and then decreases in air pressure. The oscillations in air pressure (high then low then high and so on) make the waves which manifest in our perception as pitch: rapidly oscillating waves have higher pitches, while more slowly oscillating waves produce lower pitches. Through a lot of math**, we can take a sound like a composite home run bat crack and decompose it into a set of frequencies, as well as the volume of each one of those frequencies. Appropriately, this kind of decomposition is called a frequency analysis, and it makes a graph that looks like this: On this graph, frequency is on the horizontal axis (in hertz), and the amplitude of that frequency is on the vertical axis. I don’t want to walk through all of this, because it’s not all that relevant (yet). I do want to note a few important points, however. The main peak in this analysis is right at 1 khz, exactly where Dr. Alan Nathan, expert on the physics of baseball, said it would be (science!). For this and the following graphs, I put a faint green line at 1khz as a reference. Secondly, you can see that there’s a bunch of other frequencies with significant volume in the data, including some other peaks. For comparison, here is the same graph but for groundballs (both hits and outs): You’ll note that the overall shape of the graph is the same, but the dominant peak at 1khz for home runs is much diminished for groundouts. Instead, the loudest sound is something at a lower frequency around 500 hertz. Now let’s look at the frequency spectrum of 10 line drive singles: Here, the peak at 1khz is the second loudest, beaten by a peak (1.4 khz) present but diminished in the other batted ball types. If we plot all the events together, we get the following. There’s many other small differences, but I don’t want to get drowned in minutiae; the point I’m trying to make is that different batted ball types produce different frequency spectra. I hope these are visually obvious, despite the complexities of the frequency spectra graphs. A way of summarizing the differences, as I have already alluded to, is to look at the peak frequency of each batted ball type. Alan suggests that “When the relative ball-bat speed is higher, the collision time is shorter and peak frequency is higher.” So harder hits should produce higher frequencies. In addition, with regards to where on the bat the contact is made, Alan writes: "For impacts (away from) the sweet spot, the bat can more easily bend, resulting in longer collision times and lower frequencies”. In other words, when the contact is close to the sweet spot, frequencies should be higher, and when the contact is further away, the frequencies should be lower. Alan’s predictions are borne out. Line drives have the highest peak frequency (~1.4khz), and are (by nature) struck hard. Home runs are second, with a peak at 1khz. For groundballs, peak frequency is at a much lower level (~500 hertz), implying a worse contact. If you calculate a peak frequency for each individual hit (instead of all of the hits of a given type put together), you can see that, while the data is messy and overlapping, the general relationship between peak frequency and hit type is there. Intriguingly, groundball outs show a lower peak frequency than groundball singles (just like we heard above), implying potentially worse contact. You might expect home runs to have the best contact, but I’m not so sure that should be the case. Home runs might travel the furthest, but they don’t necessarily result from the most perfect bat-to-ball contact. Some are probably hit above the sweet spot on the bat, which gives them a more upward trajectory. Perusing the pages of the HomeRunTracker, one finds plenty of homers with speeds off the bat that are less than a well-hit line drive, but which clear the wall due to lucky gusts or atmospheric effects. This also brings me to an important caveat in this preliminary study. I’m capturing only a few events per category, and by coincidence, several of the nine home runs I captured were of the barely-clearing-the wall-variety. There were no Giancarlo Stanton or Jose Abreu epic bombs, but a few lucky, perhaps wind-aided dingers. The results might change when I get greater numbers in each event. Herein also lies a limitation of this form of analysis. Because audio files have to be captured and processed individually, there is a lot of manual work that goes into each event. That prevented me from getting more than five to ten events in each category. In other words, the need for manual annotation of each and every contact event is, for now, a significant barrier to getting large datasets put together. Still, the prospects for analysis with this kind of data are broad and interesting. Because the sound off the bat is related to the bat/ball collision—specifically, where on the bat the collision occurred and how hard it was—we can begin to investigate questions about quality of contact. Quality of bat/ball contact meets the rare dual criteria of being both obviously significant and severely understudied. We know it’s important in all facets of the game, but getting any further than that has proven difficult because of a lack of data. It’s easy to say that a certain hitter looks like he’s making solid contact, but much tougher to verify that (as well as determine whether that’s driving, for example, an elevated BABIP). Sound analysis may offer a way to examine questions like this (and many others, too). In the spirit of the Sabermetrician’s Credo, I ought to note that I am not an expert in acoustics, and this research almost certainly has caveats and problems of which I am not yet aware. One example which I already stumbled upon—but haven’t had time or data to properly address—is the issue of microphone adjustments in different ballparks. Whether because of mic placement or audio feed processing or something else, there is definitely an effect of ballpark on the produced sounds (which led me to capture from five different games in different ballparks). This should be easy to adjust for in the future, but there are undoubtedly myriad additional difficulties in the data which I have not yet found. Even so, I have been able to show that different hit types have different sonic signatures that correspond to the quality of the contact made. There are some interesting early indications that contacts which result in hits differ in terms of the sound from contacts which result in outs, which may provide a way to tell if a hitter is driving the ball with authority or just getting lucky. Sound analysis might offer a rare view into a moment of the utmost importance in baseball: that joyous fraction of a second in which the ball meets the bat. Special thanks to Alan Nathan for his help and advice. *I used the software Audacity, available here. **The Fourier Transform.
Robert Arthur is an author of Baseball Prospectus. Follow @No_Little_Plans
|
Fascinating work, Robert.