
 5 comments have been left for this article.
 BP Comment Quick Links

|

|
July 25, 2014 Feature FocusVisual Depth ChartsThere are two products at BP that use the name "Depth Charts." Here's a quick explanation of the differences, and a reminder that one of them is Visual Depth Charts (complete with Visual Year-to-Date stats).
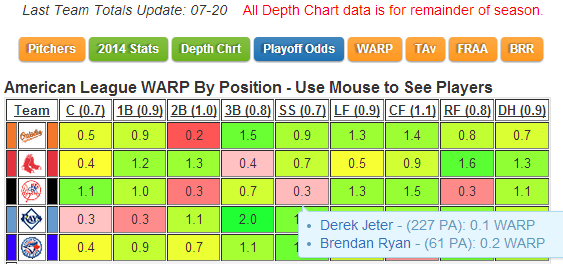
Both versions are accessible through the "Depth Charts" button on the navbar at the top of every BP page. The aim of the Visual Depth Chart is convenience. To see which players enter into a positional total, simply mouse over the number and the names will appear. For example, here's the Yankees shortstop situation:
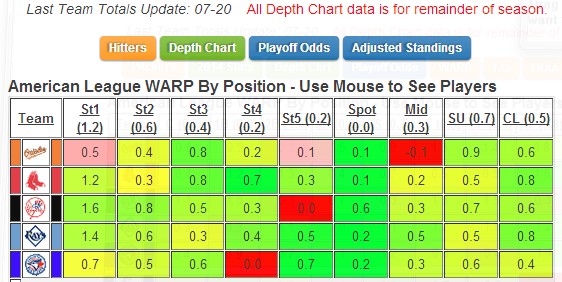
Clicking on the "Pitchers" button brings up the new Pitching Visual Depth chart, described in this article.
Clicking on "2014 Stats" brings you to the Visual Year-to-Date stats, described in this article. For instance, here's an excerpt from the BRR report, showing Billy Hamilton's great season on the basepaths:
Note: It's important to remember that rounding to one digit means that sometimes numbers don't appear to "add up," even though they do. It also bears noting that the VORP portion of WARP isn't really computed by position; rather, if a player has 80 percent of his PA at catcher, it takes 80 percent of his season-long VORP and then—for WARP—adds his FRAA at the position (divided by runs per win, of course). That's it for Visual Depth Charts. As always, comments and suggestions are welcome.
Rob McQuown is an author of Baseball Prospectus. Follow @robmcquown
|
Great work. Nothing like a good stoplight chart to start
your morning. One quick fix--the button bars need to be switched as the orange "pitchers" tab is above the hitters matrix and vice versa.
Aha, that is confusing, but they are actually correct, as they are showing you can click on "Pitchers" from the hitters page as a link to go to the pitchers page and, and vice-versa.