
 5 comments have been left for this article.
 BP Comment Quick Links

|

|
June 17, 2014 MoonshotStriking Distance
"To be a good hitter you've got to do one thing: Get a good ball to hit."
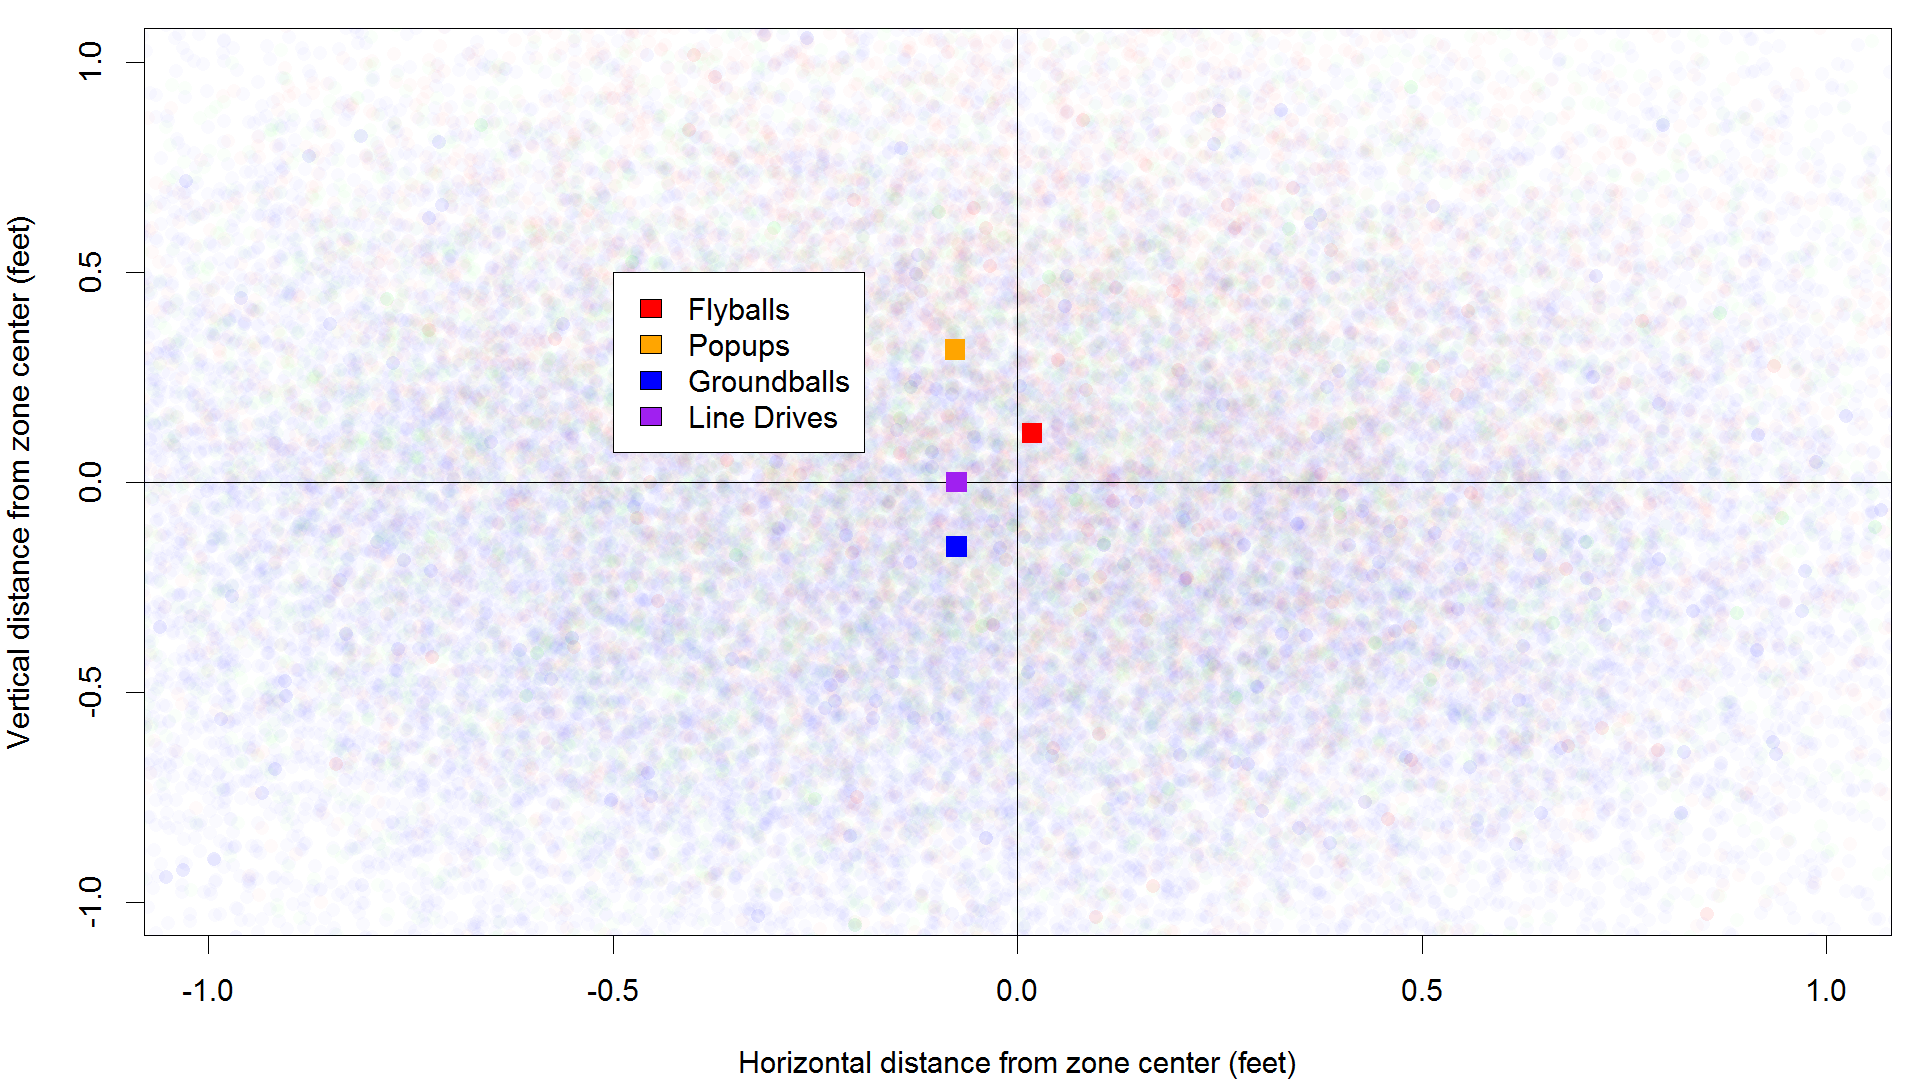
On the face of it, Hornsby’s quote sounds somewhat vacuous. After all, batters don’t control what balls they get, at least not directly. Pitchers decide, at least to a first approximation, where the ball will go and whether it will be “good” or not. Hitters are faced with a simple dilemma: to swing or not to swing. Yet Hornsby was one of the greatest hitters in baseball history, having amassed some 127 bWAR by his retirement. Perhaps we ought to indulge him, and all the other hitters who speak of “getting a hittable pitch” or something of the like. Though hitters can’t directly control the quality of the pitches they see, they do exercise some indirect effect through their plate discipline. Even so, it’s not clear what a “good ball to hit” would be. As good a place as any to start might be with location. A good pitch, Hornsby might say, is one that is unambiguously close to the center of the zone. The closer, the better: that way the hitter doesn’t have to concentrate on adjusting his swing path, or leaning out over the plate, or drawing his hands up. He can just stand and let fly their strongest rip. Hitters do best when they can hit line drives and worst when they pop up, so I reasoned that one place we might see how pitch quality affects contact quality is in the batted ball categories. I took all the pitches from the 2013 season thrown to right-handers and grouped them by the batted ball outcome. I plot here the center of the strike zone, with the median positions of each batted ball group.
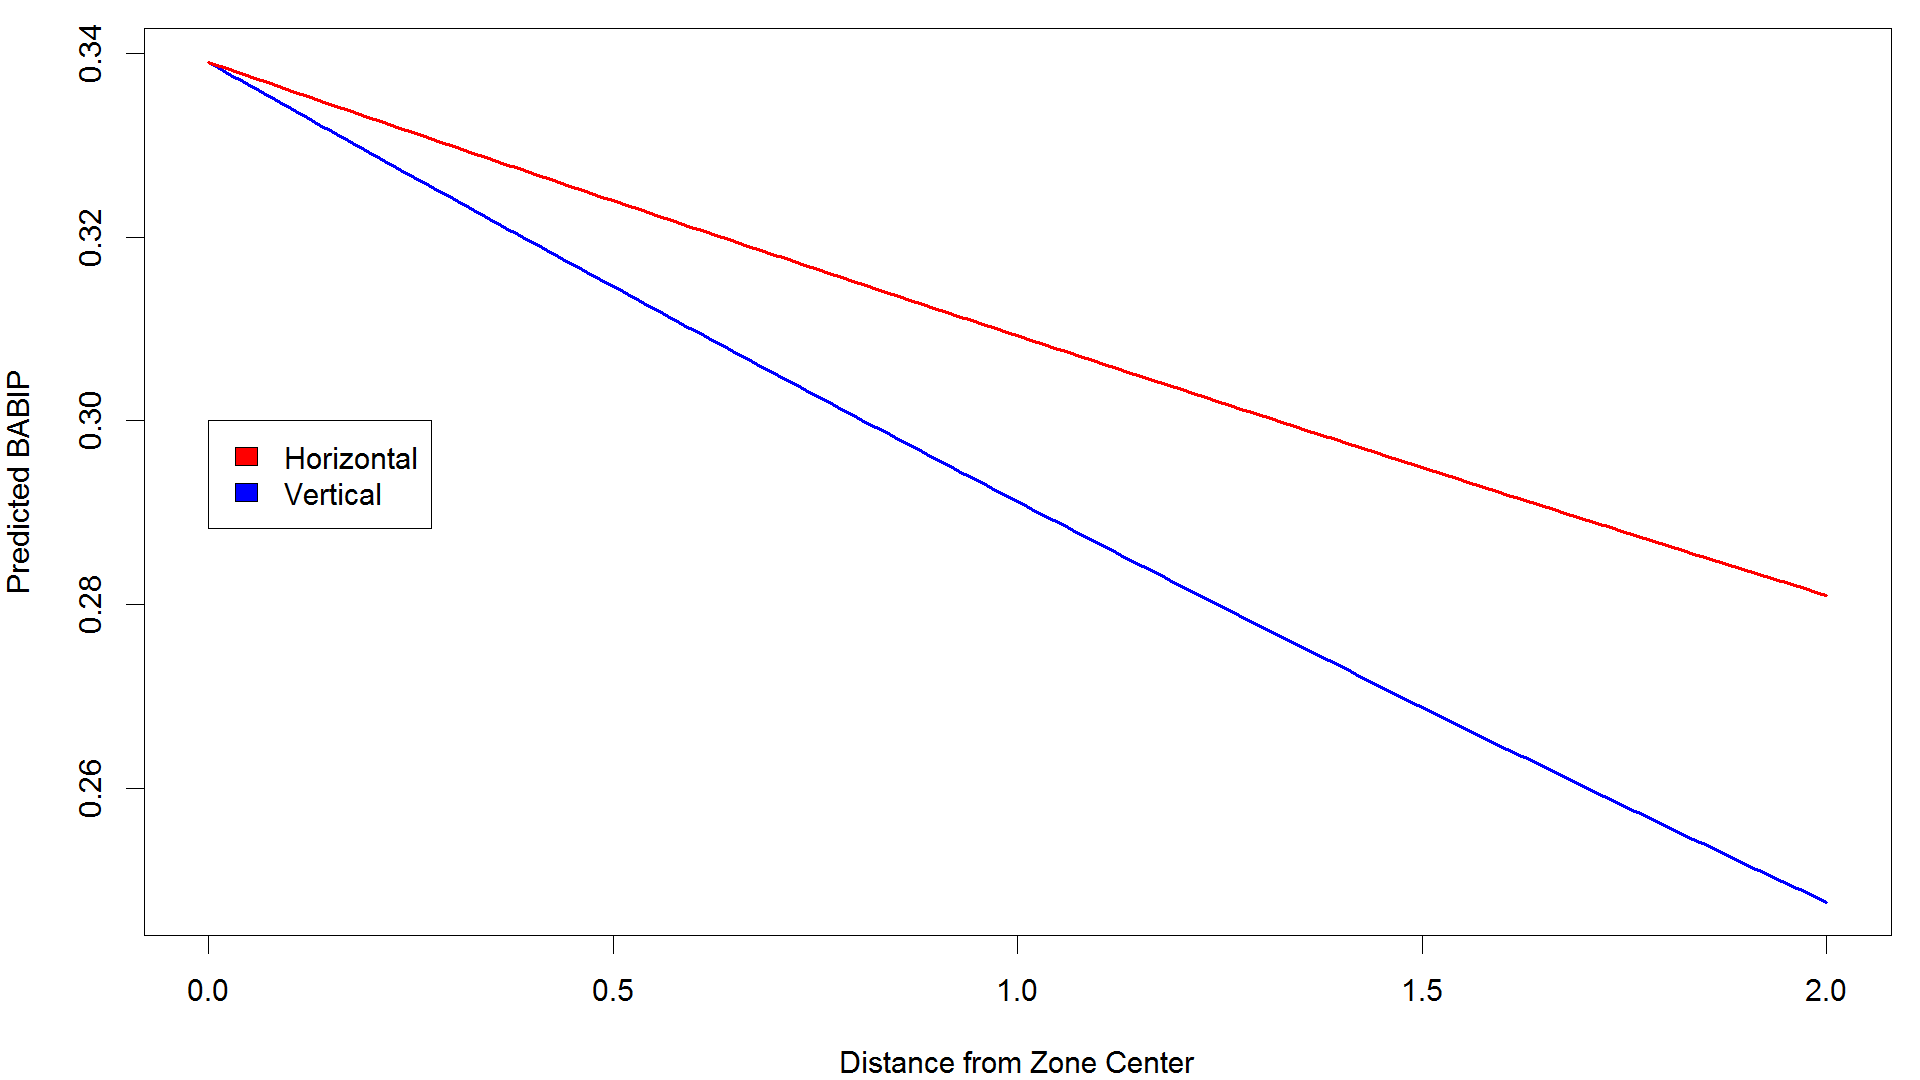
There’s a nice symmetry to the observed results, in that the ordering of launch angles is mirrored in the median height of each category of batted ball. Flyballs and popups tend to come from pitches that are struck higher in the zone, while groundballs result from lower pitches. Meanwhile, line drives—the worst category, from the pitcher’s perspective—show up as being closest to the zone center, where batters can put the hardest swings on them. As an aside, there’s a curious tendency of flyballs, but not any of the other categories, to be hit a little bit more outside. That is not a result of handedness, since I’m limited here to RHH, nor does it seem to be random variation, as bootstrapped confidence intervals put it well outside relative to the other pitches. If there’s a simple explanation for this, I’d love to hear it. The overall symmetry between where a ball is thrown and the batted ball category that results suggests one way that hitters control their struck ball outcomes, and by extension, their BABIP. While it’s not often thought of in this way, this kind of graph illustrates that plate discipline affects hit quality. A patient hitter will avoid pitches too high or low in the zone and try to drive something down the middle. In the center of the zone, where Hornsby’s good balls fly, a hitter is most likely to unleash a line drive. Still, the objective of every hitter is to get hits, not line drives. What’s more, there are certain problems with batted ball classifications, which Colin Wyers has eloquently demonstrated. So while a correlation between pitch position and batted ball types is interesting, it isn’t ideal. I decided to try another approach. I gather all of the balls put in play in 2013 for which there was PITCHf/x data and modelled the probability of a hit using a logistic regression. I created two predictor variables: horizontal distance from the center of the zone, and vertical distance from the center of the zone (the latter was customized for each batter, since heights differ). Just as Hornsby predicted, and the batted ball data implied, the less distance between a pitch and the center of the zone, the more likely it was to fall for a hit. I illustrate that effect in the following figure.
In the dead center of the zone, the predicted BABIP is a solid .340, which would have ranked 23rd-highest out of the qualified hitters last year. Interestingly, the regression assigns quite different slopes* to horizontal (red) and vertical (blue) distances from the zone center. Typically, vertical distance from the zone center is more significant in determining BABIP, whereas horizontal distance lags behind. Physically, the greater importance of vertical distance in determining contact quality makes intuitive sense. Earlier, we saw that the primary determinant of batted ball type was the vertical distance. If it’s too high, the batter pops up, an outcome with terrible BABIP. Too low, and the batter grounds the ball, more than likely leading to an out. In addition, I expect that it’s harder for a batter to adjust his swing vertically than horizontally, if only because the margin of error is smaller: The bat head is longer than it is wide, so whereas a slight horizontal miscalculation can still allow for solid contact off the main axis of the bat, almost any kind of deviation vertically will affect the launch angle and result in a poorly-struck ball.
Proximity and Power
This graph depicts the median distance (horizontal and vertical) from the zone center of the four kinds of hits. Singles are farthest from the zone center, on average, at a median distance of .69 feet. Doubles are next, being substantially (10 percent) closer to the zone center. Then there are home runs and triples, found close together: on average .57 and .58 feet from the zone center. Home runs are closer horizontally to the zone center, but actually slightly higher (more distant from the center vertically). If we recall that flyballs were often found slightly higher in the zone, and that most home runs are categorized as flyballs, the slight increase in vertical distance for home runs ought to be unsurprising. Once again, we find a tidy ordering in terms of distance from the zone center and the quality of the batted ball. The best results are obtained when the pitches are closest to the center of the zone. The better the ball (from the hitter’s perspective), the closer it is to the center of each hitter’s zone, and the more damage he can do with it. Perhaps this Hornsby fellow knew a thing or two after all.
Putting it Together I am convinced that these are important measurements because they encapsulate two interrelated aspects of the hitter/pitcher matchup. Zone distance is solely the province of the pitcher and reflects the extent to which the pitcher fears the hitter’s power. The lower the zone distance, the more a pitcher is willing to challenge a hitter in the zone. Similarly, swing distance is solely the decision of the batter. The batter will see all kinds of pitches, some close and some far; which he swings at is entirely up to him. The lower the swing distance, the more likely the hitter is to make quality contact. As I’ve tried to demonstrate above, there is real significance to getting a good pitch to hit, both in terms of BABIP and power. Good pitches for the hitter are close to the center of the zone. While the differences between homers and singles in zone distance are small on a per-pitch basis, they rapidly add up when you consider that a typical hitter will see thousands of pitches in a season and put several hundred in play. I can verify just how important these metrics are to a hitter with some regressions. If you take all qualified hitters from the 2013 season and regress ISO, a measurement of power, on zone distance and swing distance, you see these two metrics explain about 35 percent of the variation in ISO**. Considering that both kinds of distance come solely from the PITCHf/x data and measure nothing whatsoever related to the results after a pitch is struck, I would contend that such a level of explanatory power is notable. These distance statistics are somewhat like a hitter’s version of peripherals: They can help to explain how a hitter does his damage and provide some predictive value as well. On-base percentage is similarly affected by the two distances. Combining zone distance and swing distance in the regression, we see that both together explain 22 percent of the variation in OBP. In terms of OBP, the interpretation is perhaps more straightforward: The better a hitter is at controlling their swing, the better their OBP. The more pitches they see outside the zone, on account of their ability to intimidate the pitcher, the better their OBP will be. Zone and pitch distances sit at the intersection of plate discipline and contact quality. Strong hitters drive higher zone distances and decrease the quality of the pitches available for them to hit. In return, the hitter’s patience must increase so that he swings only at the best pitches left to him. Without delving too far into the gory math, I hope that you can picture this situation as a sort of equilibrium, in which the hitter’s skill is balanced against his patience like a see-saw. When that equilibrium is disturbed—because of injury, or changing skill level of the hitter—we see the changes reflected in the ripples of these PITCHf/x distance metrics. Of course, probably the hardest aspect of being a good hitter at the major league level is convincing pitchers you are to be feared in the first place. Still, Rogers Hornsby was right, at least for Rogers Hornsby: The toughest thing for a good hitter to do is wait until the right pitch comes along.
* The model, in terms of estimated BABIP, is: BABIP = -.0478 * vertical distance + -.0298 * horizontal distance + .339 ** Even though there’s a correlation here, we must be aware that causation is more complex. Zone distance is controlled by the pitcher, and so is probably an effect of ISO. On the other hand, swing distance is up to the hitter, and I would bet has a causal relationship with ISO.
Robert Arthur is an author of Baseball Prospectus. Follow @No_Little_Plans
|
Very nice work!
thanks!