
 11 comments have been left for this article.
 BP Comment Quick Links

|

|
May 29, 2014 Pebble HuntingPitchers at the Plate: Even Worse Than We Thought?
You can see what Buck Showalter was going for on Tuesday night. Mark Reynolds is a hitter. Not always a great hitter, but one of the couple hundred best in the world, and very capable of ending the game with one swing. The guy behind him was a pitcher. Not a terrible hitter, pitcher-wise, but a pitcher. In the categories our brain creates, pitchers are non-threats. Given the choice between a threat and a non-threat, the decision to intentionally walk the threat to face the non-threat feels obvious, if you don't do the math. But you should do the math:
The math, simplified: 5 percent chance that Reynolds homers*; 8.2 percent chance that Gallardo homers or doubles, which we'll say drives in Reynolds; 3.8 percent chance that Gallardo reaches via walk, single, or HBP and Herrera singles (driving Reynolds in); and about a half-percent chance that Gallardo reaches somehow, Herrera walks or is hit by a pitch, and Segura drives Reynolds in. That’s a 5 percent chance on the left, and about a 12.5 percent chance on the right. Added to this, there’s about a 28 percent chance that Reynolds might have reached via a non-homer hit, a walk, a hit-by-pitch, or an error anyway; and (as established) a 12.5 percent chance that he'd have scored in such a situation, so we have to add that to the left, which gets us roughly to:
This, of course, still can’t capture everything—the benefit of burning Gallardo as a pinch-hitting option; the pinch-hitting penalty on Gallardo's true talent; the possibility of a stolen base or baserunning gaffe; the possibility that Reynolds would have doubled or tripled, which I lumped into the “might have reached anyway” adjustment but which should fairly be credited to the left-hand side of the equation. But this article isn’t actually about this question. Rather, it uses the question as a jumping-off point for a tangential question, so I’m going to move on to the actual point of this article, which is:
Do we really know how good a hitter Yovani Gallardo actually is?
The math we just used presumes we do. We have nearly 500 plate appearances that tell us what he’s likely to do when he’s hitting. But are all pitcher plate appearances equal? Here’s the hypothesis, all parts of which are speculated only at this point:
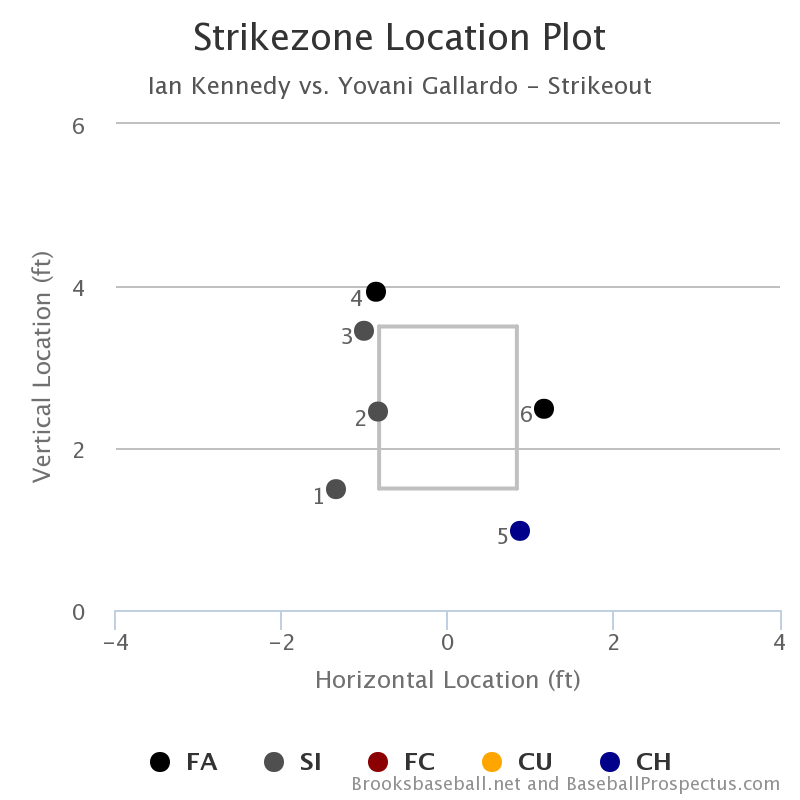
Pitchers get pitched much easier when the stakes are low, the result being that their overall numbers are inflated. When the defense needs to get pitchers out, they can, because in those situations they bear down and break out the sliders. We have very few examples of a pitcher hitting in that situation, and thus don't know what a pitcher hitting in that situation is likely to do. Showalter might have reasonably hypothesized that Gallardo is not actually as good as the ex-post-facto articles pointed out. Is this correct? *** In the past two years, two of Gallardo’s three highest-leverage plate appearances (excluding sacrifice situations) have come against Ian Kennedy. Fortuitously, Gallardo also batted at least once in a low-leverage situation against Kennedy in the same games, so we can sort of compare and contrast the way he was pitched depending on the mood of the game. Here are 2013’s pair:
Is it clear to you which one is higher leverage? This isn't a trick question, and I'm not implying that it should be. I know, but can you tell?
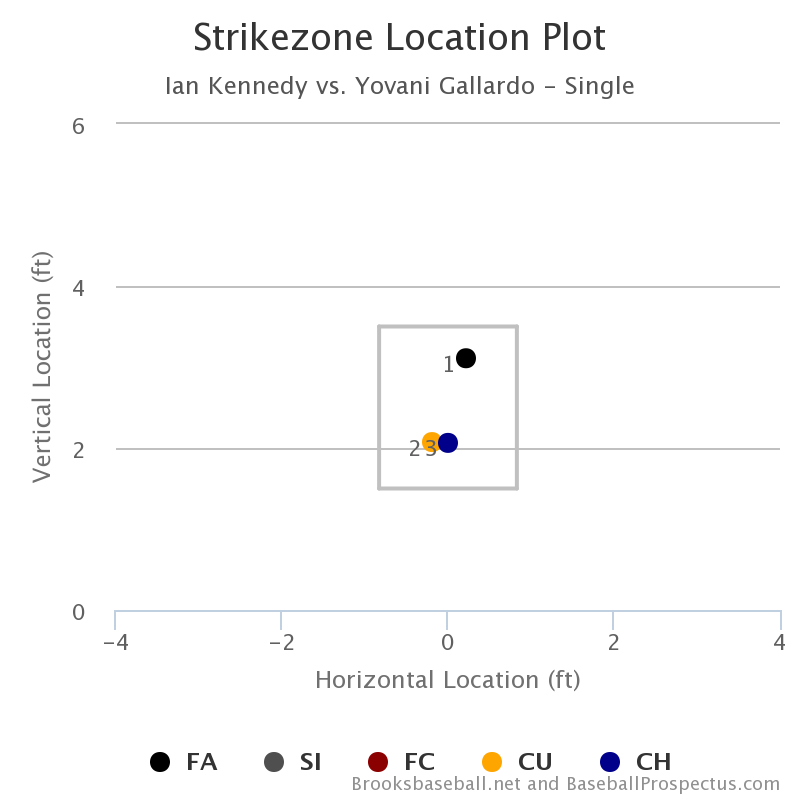
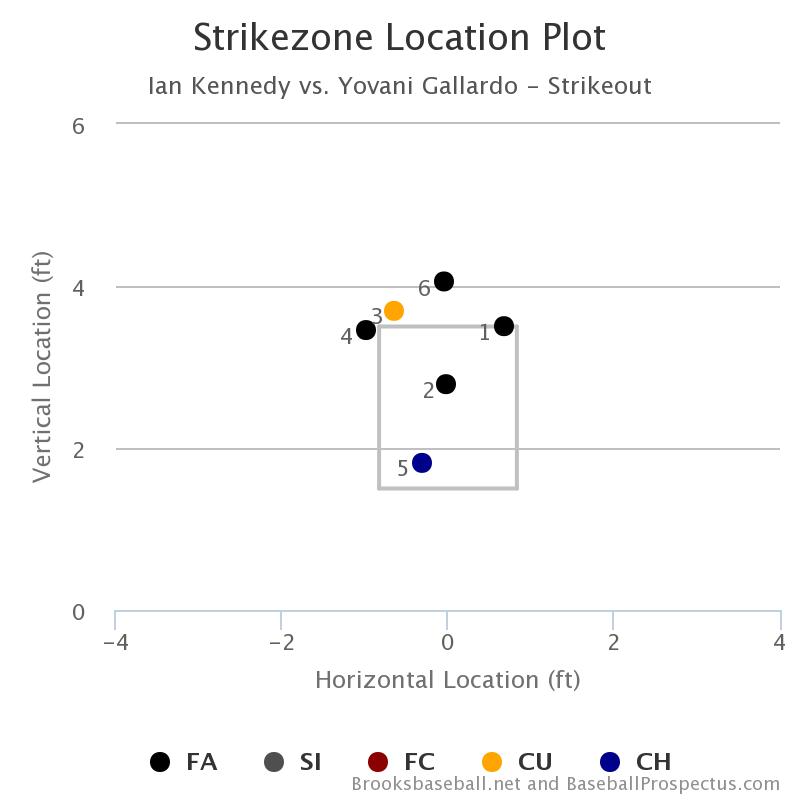
What if I give you a little more information? In the plate appearance on the left, the fastballs were 90, 91, 92, 92, and 94 mph. On the right, the lone fastball is 89 mph. I'm not trying to steer you toward anything, but my read on this would be that, in the high-leverage plate appearance on the left, Kennedy was much more careful with Gallardo. He worked the edges. He mixed up his locations. He threw harder. He started the at-bat with sinkers. In the low-leverage matchup on the right, he basically goes right at the center of the plate, leading with a BP four-seamer. Alternately, you might focus on the fact that he threw a breaking ball and a changeup with the next two pitches, indicating respect; that's a fine interpretation, and there's no conclusive answer here. My take is that those pitches sitting in the center of the plate indicate Kennedy's complete lack of concern, that every pitch reads "get it over," but I'm just over here speculating. Here are 2014's matchups:
Can you tell which is which here? Would the fastball velocities help? On the left we have 92, 93, 93, 93. On the right, 91 and 90. The dangerous at-bat (for Kennedy) is again on the left, and again I think you can turn this into a constellation if you want to: Kennedy mostly stays out of the zone in high leverage, and throws harder. It's not quite as strong a contrast this time: he also stays out of the middle of the zone in the low-leverage at-bat. Nothing conclusive, but I think there's enough of a suggestion of intent here for us to move on to the next step.
*** I took every pitcher who has at least five plate appearances since 2012. There are 276 of those guys, and combined they've got about 13,000 plate appearances, so that's a bunch. Their weighted OPS is .331, which is what pitchers do. They produce a .331 OPS. They're terrible. But what about in high leverage? Using Baseball-Reference's definition of the term, we find that these 276 guys had 2,270 plate appearances when it really mattered. The weighted average OPS: .308. They're quite a bit worse when it matters, as hypothesized—about 93 percent as good as expected. You're wondering whether, in fact, all hitters are worse in high leverage. They're not. Since 2012, the league's OPS is one point higher in high leverage than overall. Since 2000, it's three points higher. Call it even, and you'll still conclude that something's happening to pitchers hitting when their counterparts on the mound stop being polite. Maybe there's something about high-leverage that's throwing this off—high leverage statistically, after all, might not correspond closely to what the participants themselves understand to be high leverage. So repeat the exercise with runners in scoring position, when we can assume that no matter the game state, the guy on the mound will be diligent in protecting his ERA. Our group of 276 has 3,430 plate appearances with runners in scoring position, and their collective OPS is .313. Now, the league overall does perform differently with runners in scoring position (for various reasons—pitcher quality, the difficulty of playing an extreme shift in such situations, working from the stretch, who knows, all sorts of stuff). The league overall gets a one or two percent OPS bump with a man on second or third. Pitchers, if they got the same bump, would be expected to have about a .336 OPS. Their actual collective OPS is about 93 percent of what it should be. *** Nothing's ever that simple. It could be that, in high-leverage situations, pitchers are more likely to be asked to sacrifice. Sacrifice attempts are discriminatory for pitchers' batting lines, because they can lead to strikeouts (or two-strike holes) but virtually never to base hits. That could be. It could also be that this applies less to pitchers like Gallardo, who can actually hit, and who might at least get backup-catcher treatment at the plate regardless of the circumstances. Maybe Gallardo, in other words, is exactly as good as his OPS, no 93-percent adjustment necessary. But we've all seen the way pitchers get pitched to under typical circumstances. The defense wants to get rid of them. They want to do it in as few pitches as possible. They want to do it with the smallest possible risk of a walk or a hit batsman. It makes sense that, when faced with an actual challenge, they'll do worse. Around seven percent worse, it looks like. So, if we want to bring it back to Gallardo, we would say that Showalter should have probably done the math. He probably did the wrong thing on Tuesday night. But the truth is that we don't always know how good the guy at the plate really is, especially when the data that make up his record are legitimately skewed by context. *Reynolds' math extrapolated from his 2011 to 2014 statistics. For Gallardo, Herrera, and Segura, career totals were used to establish true talent.
Sam Miller is an author of Baseball Prospectus. Follow @SamMillerBB
|
I think it would be fair to question how "high" high leverage really is. After all, when was the last time you actually saw a pitcher hit for himself in a meaningful situation after, say, the fifth inning of a close game? Also, I think something that could be looked at regarding pitchers hitting is how effectively they're pitching that day. Managers will often let them hit if they think the guy's going so well that he won't need the runs he might miss out on by letting his hurler stand in. I know this article doesn't intend to go this far, but pitcher hitting (or lack thereof) is a fascinating topic.