

 19 comments have been left for this article.
 BP Comment Quick Links

|

|
April 28, 2014 MoonshotHow Quickly Do Team Results Stabilize?
With the end of April looming, we can begin to shed some of our fears regarding small sample size. Statistics like strikeout and walk rates have passed critical thresholds on their march toward stabilization, and so we are beginning to get a first look at how well individual players will perform. The requisite early-season loss of ~20% of each team’s starting rotation to the failure of a certain crucial ligament has taken its toll, resulting in a clearer picture of who will make each team’s starts. All of which is to say, we can begin to turn our attention to matters larger than individual players. Since the ultimate goal of every team is to win a championship—and the best way to win a championship is simply to field a very good team—the question of utmost importance is simply: How good is my team? In light of this question, I examine here how quickly team quality stabilizes over the course of a season. At a fundamental level, good teams are defined by 1) scoring lots of runs, and 2) not allowing the other team to score many runs. Therefore, I take as my measurements of quality runs scored per game and runs allowed per game. While there is a simple relationship between the number of runs scored/allowed and wins (via the Pythagorean expectation), that relationship is quite noisy. First and foremost, the noise results from sequencing, or the luck a team has in apportioning its runs to individual games. A bad team may thus end the season with an excellent record and a playoff berth, despite an underlying lack of quality. Nevertheless, all else being equal, good teams (those that score many runs and don’t allow many runs) are more likely to make the playoffs and win championships than bad teams.
Estimating Quality
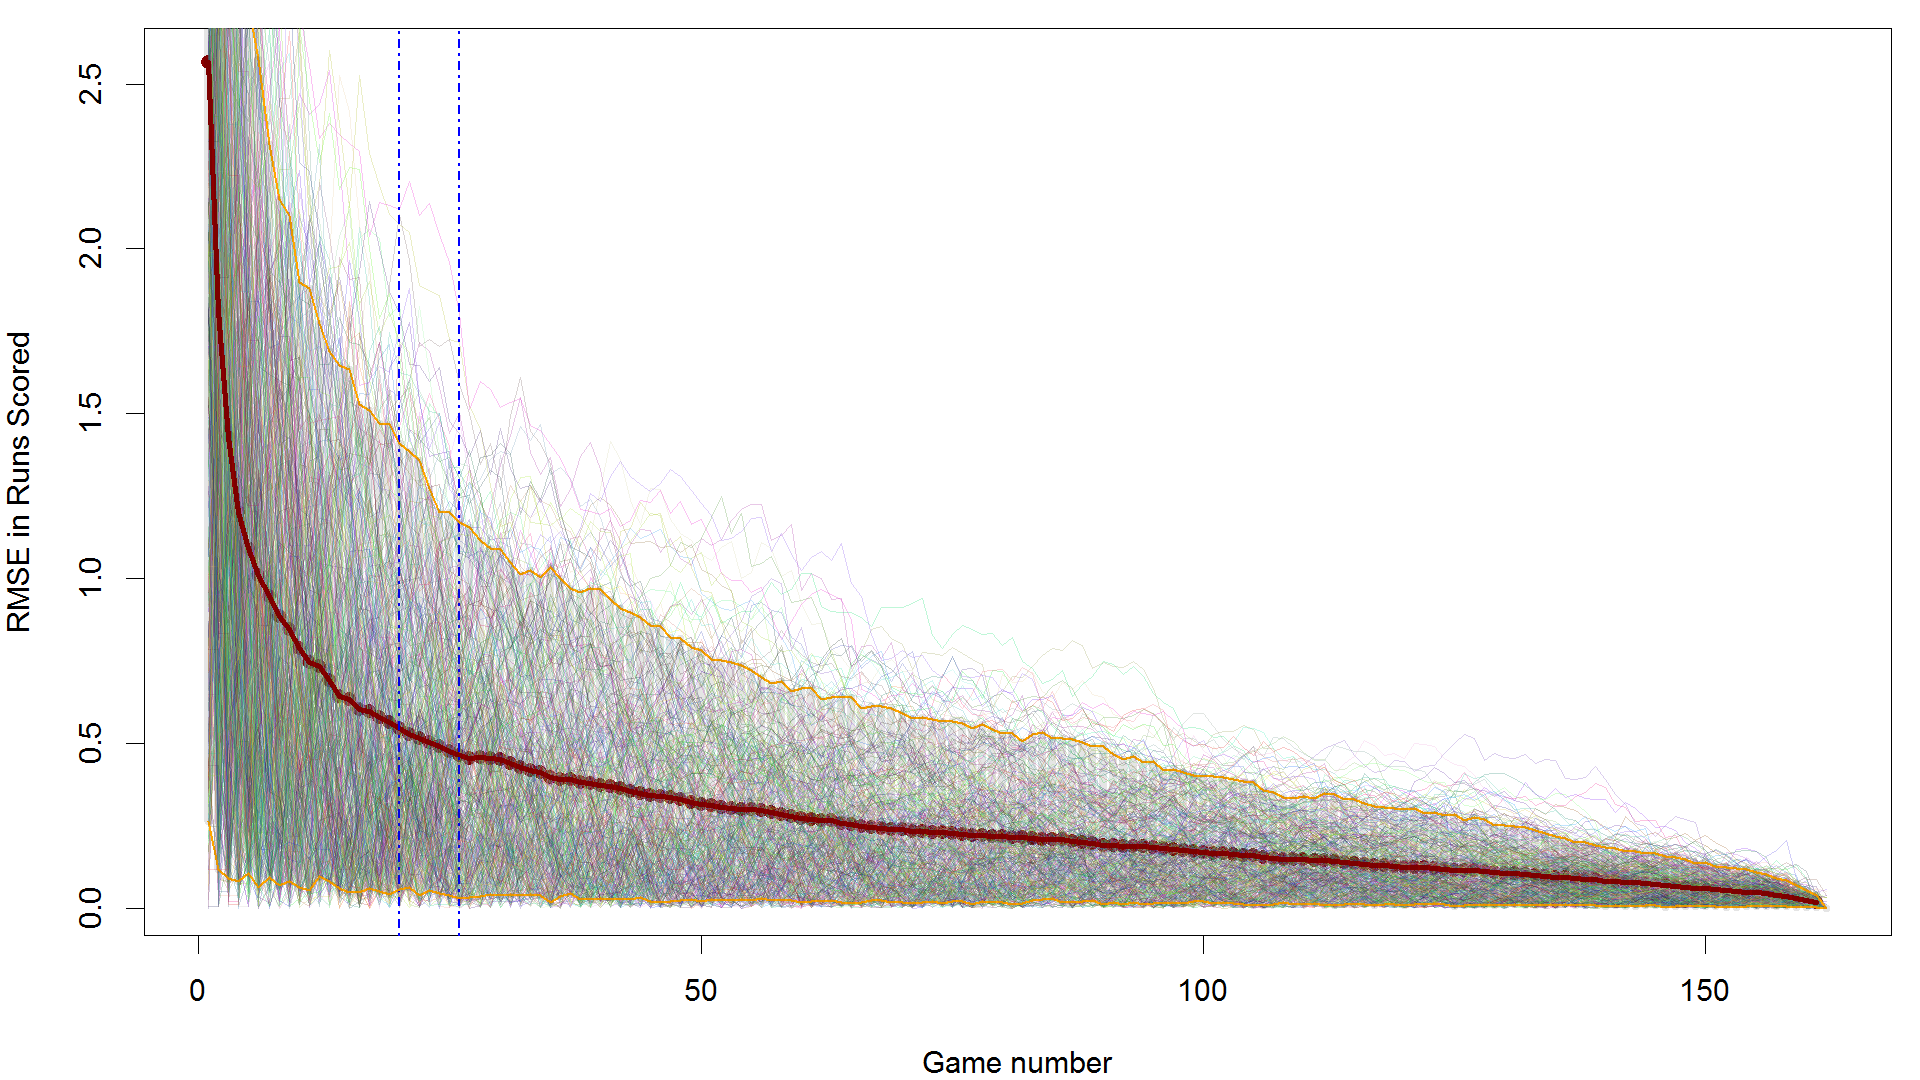
I plot here the root mean squared error (RMSE), a measurement of how accurate a prediction is, for the 420 team-seasons in my dataset, over the course of a season. Each line represents the error of an individual team’s season, which decreases as the season progresses (since the error is calculated relative to the final RS/game over the full season). The red line is the mean squared error, over all 420 team-seasons. The blue dashed lines represent the range of game numbers that teams have played so far, between 20 and 30. You can see that guessing with the runs scored per game at this point in the season, you would tend to fall within ~.5 runs per game of the actual value. While .5 sounds small in absolute terms, it is quite large in terms of runs per game; it is the difference between the 2013 Detroit Tigers’ offensive output and the 2013 Toronto Blue Jays’, for example. I have shaded the area representing the 90 percent confidence interval of the error (orange lines delineate the boundary of this confidence interval). This interval implies that while one could predict the RS/G to within .5 runs, one could also be off by as much as ~1.25 runs per game or as little as ~.1 runs per game. Variability in the predictive accuracy is huge this early in the season. A good offense could collapse and become terrible, or a terrible one could improve and become great. Let’s take a look at the same graph, but for runs allowed, with the hope that the situation is not as variable.
The shape of the runs allowed prediction curve is almost exactly the same. In retrospect, the similarity was probably to be expected, given that every run scored is a run allowed for another team. Approximately the same dynamics hold for this graph: you could guess the RA/G of a team within about a half run, but you could just as easily be exactly right as be off by a run and change. There are some minor differences between the two prediction accuracy curves. If you look very closely and compare them side-by-side (or statistically), you’ll note that the Runs Allowed curve tends to have a few more outliers over the course of the season. By this, I mean that the extreme deviations from the final RA/G, beyond the limits of the confidence interval, are a little more extreme for allowed runs than scored runs. That reflects what we know about pitching, and specifically the tendency of pitchers to get injured more often or just demonstrate fluky runs of unsustainable success or failure. In both cases, we see that accurate prediction of a team’s offense or defense is severely limited this early in the season. While it might still be beneficial to know a team’s RS/RA within .5 runs or so, the true accuracy of the guess can fluctuate wildly, depending on the particular team. It might be tempting to conclude that we ought to simply forgo prediction until later in the year, when the sample sizes are larger still. But we can do better.
The Primacy of PECOTA Around these parts, the projections of choice are none other than PECOTA. I took PECOTA’s preseason projections for the 2013 season and contrasted the accuracy of PECOTA’s single-point estimate of each team’s RS with the increasingly accurate average RS/G over the course of a season.
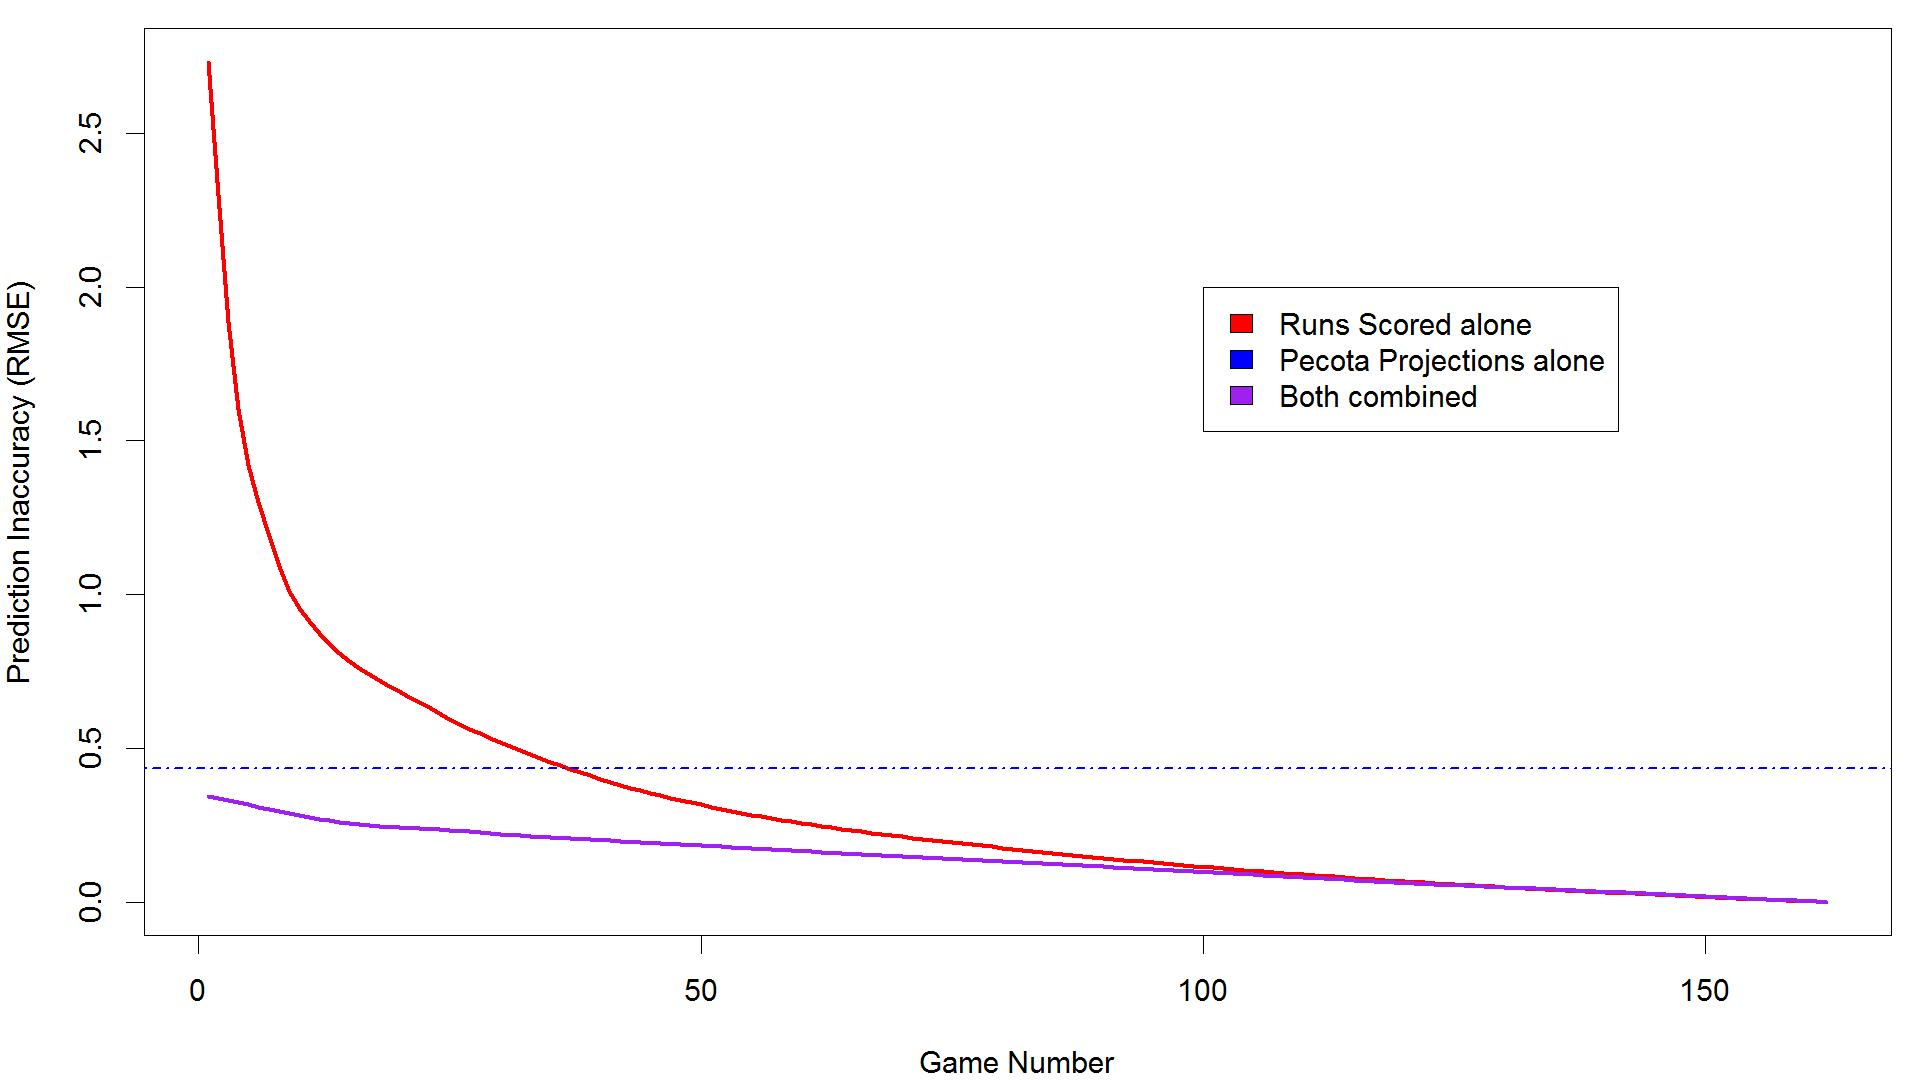
This graph is similar to the above graphs, but using PECOTA projections and runs scored. PECOTA alone, with no updating to account for the season in progress, is quite accurate. In fact, using the PECOTA projections is more accurate than season-to-date RS/RA until about the 30th game—a point no teams have reached in 2014. However, PECOTA is still off by the familiar .5 runs per game margin to which we have become accustomed. There is hope for prediction accuracy yet, however. I also built a combined, linear model that integrated PECOTA’s projections and the season-to-date RS numbers. I trained the model with 2012’s projections and runs/game numbers and then applied it to 2013’s data. As expected, this combined model outperforms either source of data alone. In fact, the season-to-date stats don’t approach the accuracy of the combined model until around the 100th game of the season. Between games 20-25, where most teams presently lie, the combined model is accurate to within ~.25-.2 runs per game, for both RS and RA. It displays another excellent characteristic, as well. The maximum deviation for this model over this game range was no more than .4-.45 runs per game. To put it differently: the maximum deviation of the combined model was less than the average deviation of the rolling RS/G model alone. With that said, let’s run the model on 2014’s data (Runs Scored):
In some ways, the model’s takeaway is unsurprising. In general, a given team’s projected RS number is going to be somewhere between PECOTA’s projection and the RS number the team has accrued so far. For fans of offensively overperforming teams, like the Twins and the White Sox, that’s going to be a bit of a downer. For fans of the underperforming teams, such as (most prominently) the Diamondbacks, this projection may offer some slim solace (but they are still a very long shot for the playoffs). In a broader sense, this research illustrates that by incorporating orthogonal predictive information, the accuracy of a model can be rather drastically improved. That was the case with pitch velocity, and it’s the case with team-level projections, and it’s probably the case with a lot of other things as well. In the case of predicting a team’s quality, one can forecast runs scored and allowed to within less than a half-run and below as the season proceeds. As I noted before, there’s still a layer of complexity between the runs scored/allowed and who actually wins games. While scoring and preventing runs is the raw output of good teams, the timing of those scored and prevented runs determines whether a good team will also be a winning team (and by extension, a playoff team). Still, there’s a lot of baseball yet to be played this season, and it may cheer the fans of a few good teams to know that while victory is elusive, your team is probably better than its record says.
Robert Arthur is an author of Baseball Prospectus. Follow @No_Little_Plans
|
You say: "In general, a given team’s projected RS number is going to be somewhere between PECOTA’s projection and the RS number the team has accrued so far."
Why would it ever be anything else? How, for instance, do we account for the Orioles who are outperforming their PECOTA so far, but are projected to finish below that level?
Mathematically, a linear model has the variables in it (in this case, RS so far and PECOTA projected RS), and also an intercept. So if the intercept for a particular model is say -.1, and the RS and PECOTA numbers are each pointing towards 4.2 RS, the model might spit out 4.1, because of that intercept.
Generally, I would take the above numbers with a grain of salt. They are provided for illustrative purposes, rather than as definitive predictions. The point of this article was to show how quickly RS/RA stabilized, and to demonstrate that preseason predictions still carry some weight (and will until ~ game 100). If people are interested in maximally accurate predictions, maybe I can do a follow-up with some more sophisticated models.
(With that said, it's also possible I just made a mistake in entering the numbers in the table. I'll go back and check to make sure.)