


 10 comments have been left for this article.
 BP Comment Quick Links

|

|
February 17, 2014 Baseball TherapyLooking for Meaning Amid the Small-Sample Flukes
Last week, we discussed a new method for looking at how players change within a season. Baseball stats are normally denominated in years, but the problem with yearly stats is that they obscure any growth and development—or regression—that might have taken place. Six months is a long time. Players can change. This week, I want to look at how we might use that method to teach us something about the growth of individual players. I’ve been focusing my attention on one specific decision that a hitter makes, the decision of whether or not to swing at a pitch. It’s a decision that the batter gets to make every time the ball is thrown his way, so we have a large number of data points to work with. Warning! Gory Mathematical Details Ahead! I looked only at the 2013 season to see which players had a swing rate that could be best described, from pitch to pitch, by some sort of moving average. Out of 258 qualifying players—min. 250 PA and 1200 pitches faced—146 (64.4 percent) fell into this category. For some of them, the best moving average was the swing rate from the last 100 pitches. For others, 500. I tested everything from 50 to 1000 by 50s and let a regression pick the best fit for each player. For each player in that 64.4 percent, I ran a logistic regression (and by that, I mean 146 separate logistic regressions) predicting the chances that each plate appearance they had would end in an on-base event (walk, HBP, or hit). I keyed the moving average to reflect what it was during the first pitch of the plate appearance. This told me whether there were players who had better (or worse) OBP results when they swung more. There were 17 players who had a significant association between in-season swing rate and their chances of getting on base. Let me show you a few case studies and how we might use their examples. The Success Story: Jedd Gyorko
Gyorko’s swing rate was best described by a moving average of 950 pitches, so we pick up his season 950 pitches in, which is roughly two months’ worth. The regression also said that when his swing rate was higher, he was more likely to get on base. We see that he starts out at about a 47 percent swing rate. But then, something seems to happen in the red box, and he jumps by a couple of percentage points rather quickly and keeps going up. In the green box, he seems to make another jump, although by the end of the season, he is back to where he started before the second jump. I’ll stop for a moment and let you think about how you would use this info. Don’t peek. Ready? Okay, we know that something changed about what Gyorko was doing. He might very well have made a conscious decision to start swinging more often. Maybe he was just gaining confidence in his rookie year. Maybe he was completely unaware of what was going on. We could pull the date that the upswing started and ask him what was happening around that time. We don’t have that information on exactly what Gyorko was thinking, but the abrupt jump suggests that it was a discrete event. The Padres may want to check in on him and ask. Maybe Gyorko had been working with hitting coach Phil Plantier and something finally stuck. How to work with the kid might be useful info to know as he continues his career in the bigs. We also know that he has shown evidence of being able to change his approach and to build on something when it showed success. Young players, even good ones, have a lot to learn, and you hope that they show a willingness to do so. Even if Gyorko looks at the graph and says “I have no idea where that came from,” he might go back to that time and see if there’s something else that seems to coincide with that time period. Was he sleeping better? Did he figure out a good game time prep routine that calmed him down? Had he just gotten more comfortable with being a big leaguer? Maybe it affected his approach at the plate as well, and in doing so made him a better hitter. Maybe there’s something he can do more of. The Uh Oh: Justin Smoak
Smoak is another hitter who has a high span on his swing rate. His present swing rate is best described (in 2013) by his last 1000 pitches seen. The disappointing Mariners’ first baseman/DH shows a steady increase over time in his swing rate, with a few small bumps up along the way. There’s a small problem. Unlike Gyorko, who saw his OBP rise the more he swung, Smoak’s diagnostics suggest that the more he swung, the less he got on base. (Sure enough, his OBP in the month of July was .372, August was .324, and Everything After was .268.) He just sort of slipped away. That’s kinda scary, and maybe illustrative of why the Justin Smoak experience hasn’t been a good one for the Emerald City. In this case, you can’t pin everything on Justin’s swinging tendencies. Swinging is one part of an overall approach. This is correlational research, and the swinging may not be causing the suck. The suck might be causing the swinging, which may in turn cause more suck…or maybe there’s some other factor at work causing both more swings and less quality. It’s also not a bad place to start looking. Maybe it’s as simple as him falling into bad habits and not knowing how to break them. The Mountain Range: Howie Kendrick
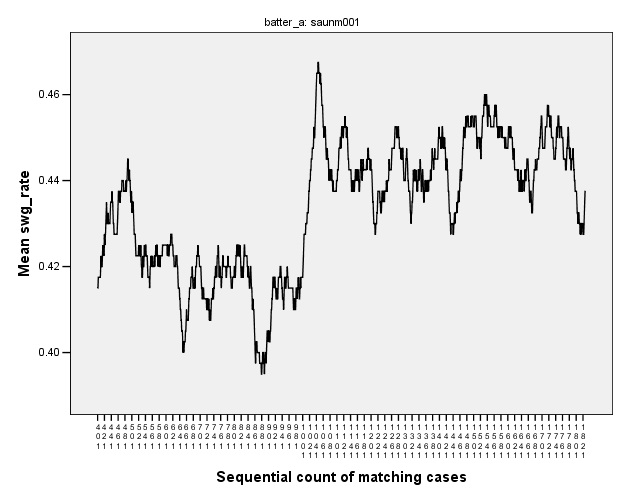
Kendrick’s graph looks like one of the background images on the original Apple IIe version of Oregon Trail. Kendrick is a guy who is best described by his last 150 pitches, so his sample completely turns over every 40-50 PA (10-12 games?). His diagnostic suggests that more swinging is a bad idea for him as far as OBP goes, but at one point during the season he hit a peak of almost 62 percent swinging. Maybe he figured he’d try something different—and the graph tells the story of how different it was. In late May and June (May OBP, .353; June .414) Kendrick had a valley in his swing rate and put up his best months of the year. And then went back to his old ways (and on the DL in August). Does that make Kendrick streaky? The fact that his swing rate is best described by only the past 150 pitches suggests that he changes his approach a lot. And the fact that it was correlated with his success suggests that his outcomes depend a lot on his approach. Let’s for a moment assume that these findings are “real.” His approach really did change, and that’s what made a difference in his OBP. It means that when he found something that worked, he wasn’t able to hold on to it. Either he was unaware of what was happening and fell back into his old ways, or he knew but didn’t have the ability to lock in those gains. In that case, we’re saying that Kendrick’s approach meanders all over the place, working its way in and out of places that work for him and places that don’t. Maybe there’s a case to be made for the existence of streaky players—not because they try to be streaky, but because they aren’t really in control of the steering wheel. The “Sometimes, it’s Not Just a Small Sample Size Fluke”: Michael Saunders
Michael Saunders, first half of the season: .225/.303/.364. Second half of the season: .251/.350/.440. Fantasy players, you are welcome. The Hidden Message: Didi Gregorius
We now come to the chart of Mariekson Julius Gregorius. Gregorius, like Howie Kendrick, had a swing rate that was best described by his previous 150 PA, but for him, an approach marked by more swinging seemed to coincide with the times when he was most likely to get on base. Gregorius’s chart fluctuates up and down and up and down and up down and up and down over the course of the season. Near the end, he struggles to keep his head above water. Gregorius never really spent too much time at his high or low points. I’m left to wonder whether he had enough time where his approach was working to fully appreciate it. Maybe he did. It might be worth the Diamondbacks showing Gregorius this chart and explaining what it says (or just going with “Y’know, when you were swinging more/were more aggressive, good things were happening.”) It’s tempting to just say “Hey, Didi, just go crazy swinging,” but that’s a little too simplistic. Instead, the D-Backs might be able to leverage information that they have from watching him up close, as well as talking to Gregorius himself, to figure out what the periods of higher swinging rate had in common. It’s possible that the answer is “I was just feeling more aggressive and wanted to swing more.” But more importantly, this is a teaching tool waiting to happen. Becoming a Time Lord We are quick to dismiss just about anything as a small sample size because of some article written by a guy who named himself after an auxiliary kitchen utensil. We don’t ask the underlying question. Did something change? Can we reasonably make the case that the player figured something out and it made a huge difference? There might be information hidden in that streak. The power of the method is that while it can’t tell us anything about baseball players as a collective, it can tell us something about specific players. Think of it as the difference of having information about “the market” writ large and an individual stock. There’s opportunity for arbitrage in both of those pieces of information. And of course, we’re also looking at only one possible proxy for a difference in approach (swing rate) and one outcome (OBP). Perhaps there are others out there. Now, before I go, I should point out that this is all rather preliminary. Did I cherry pick the graphs that made for the best stories? You bet. Did I run a bunch of regressions and (holy mass of Type I error, Batman!) find a few of them that came up significant? Yup. Maybe I’m chasing a phantom. That’s what happens when you write things up in real time. On the flip side, I’d like to think that the theory at least makes sense. Hopefully, you’ll stick with me long enough to find out.
Russell A. Carleton is an author of Baseball Prospectus. Follow @pizzacutter4
|
I like the sausage making articles.