


 17 comments have been left for this article.
 BP Comment Quick Links

|

|
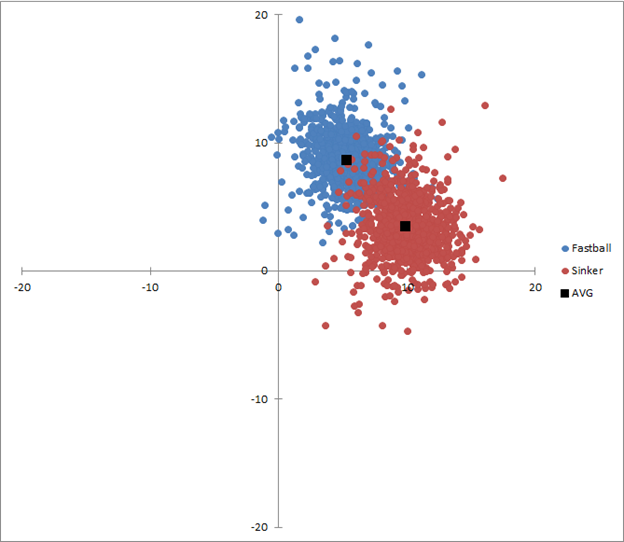
April 2, 2013 Baseball ProGUESTusWhich Pitch Types Work Best at Coors Field?Most of our writers didn't enter the world sporting an @baseballprospectus.com address; with a few exceptions, they started out somewhere else. In an effort to up your reading pleasure while tipping our caps to some of the most illuminating work being done elsewhere on the internet, we'll be yielding the stage once a week to the best and brightest baseball writers, researchers and thinkers from outside of the BP umbrella. If you'd like to nominate a guest contributor (including yourself), please drop us a line. Dan Rozenson writes about PITCHf/x and sabermetrics for Beyond the Box Score and Big Leagues Mag. Follow him on Twitter @SixToolPlayer. Introduction The Rockies targeted Houston Astros pitcher Darryl Kile, fresh off a season in which he finished fifth in the NL Cy Young voting (19–7, 2.57 ERA), and inked him to a three-year, $24 million dollar deal. That may not seem impressive in 2013, but it made Kile the fourth-highest paid pitcher in baseball at the time. Rockies owner Jerry Morris proclaimed it a “memorable moment” for the organization and “the first step to attaining a world championship.” Unfortunately for Kile and the Rockies, his stay was a disaster. In 1998, Kile’s ERA ballooned to 5.20 and his K/9 rate dropped to its lowest level since his rookie season. Still, his ERA+ was 100, suggesting he would have been a league-average pitcher if all MLB games were played in the same stadium. It was in 1999 that things got really ugly. In 190.2 innings, Kile posted a 6.61 ERA, the second-worst of all time for someone who’d thrown that many innings in a season. Worse, his road ERA (5.89) had become so bad that it couldn’t do much to offset his atrocious home ERA (7.44). It was as if Kile had been ruined as a pitcher. Bewildered by his drop-off in performance, the Rockies shipped Kile out to St. Louis, where he recovered his form from Houston. In 2½ seasons with the Cards, Kile went 41–24 with a 3.54 ERA (125 ERA+). Tragically, he died of a heart attack at midseason in 2002. Meanwhile, the Rockies were on the hunt again for starting pitching. They were even more aggressive this time, signing Mike Hampton to an eight-year, $124 million deal—the largest in baseball. Hampton had finished the 1999 season in Houston with a league-leading 22 wins and was the runner-up in Cy Young voting. In 2000, with the Mets, he was productive again and posted a 3.14 ERA in 217.2 innings. The problem was, Hampton couldn’t pitch at Coors. Before his signing, his career ERA in Colorado was 6.88. Once he started pitching there full-time, he overnight became one of the worst pitchers in baseball. He spent two seasons in Denver, accumulating a 21–28 record and a 5.75 ERA before mercifully being sent off to Atlanta. His ERA returned to Earth in 2003, at 3.84. Why did two of baseball’s biggest pitching stars, in the prime of their careers, fail so dramatically in Colorado? One hypothesis I developed is that both Kile and Hampton were known to rely on specific pitches that Coors’s thin atmosphere could have affected. Kile threw one of the most feared curveballs of his day. He played before PITCHf/x, but the video evidence suggests that it was a mean breaker indeed. Hampton’s sinker has been tracked by PITCHf/x and can be viewed below in comparison to his four-seam fastball.
The sinker clearly sinks as well as tails. The visual gap in movement between his four-seam and two-seam fastballs speaks to a great difference in their effectiveness, too. In the PITCHf/x era, batters hit .272 against his sinker (not bad, considering sinkers have the lowest whiff rates of any pitch type) versus .401 against his fastball. Yikes. It turns out that Hampton could not make his sinker work in Denver. He complained to one reporter in 2002, “I’ve just stopped throwing it. It’s been ineffective. … [It] hasn’t worked in over a year.” It’s also the case that pitch selection at Coors varies dramatically from the rest of Major League Baseball. In the 2012 season, visiting pitchers favored cutters and sliders and stayed away from curveballs, compared to MLB averages.[i]
To me this prompted the question: which pitches—and pitchers—have a better shot of succeeding for the mile-high Rockies? Hypothesis First, I will prove the existence of a “Coors Effect” on pitching that slightly decreases a pitch’s spin deflection compared to other parks, using curveballs as an example. Second, I will show that the Coors Effect is uneven across pitch types, and that sliders are the least impacted by the atmospheric change in Colorado. Pitch movement Luckily, the curveball is rarely thrown by submarine-style pitchers.[ii] The wrist “snap” on the release of a curveball is most natural when thrown from a three-quarters or over-the-top arm slot. Additionally, the “drop” characteristic of a good curve can be achieved only by imparting topspin—that is, by snapping the wrist down instead of across the body. The curveball thus has a distinctive spin deflection across MLB that makes for easy park-to-league comparison. This is easily viewed in the chart below, containing the spin deflections of a sample of 5,000 curveballs thrown by right-handed pitchers in the 2012 season outside of Coors Field.[iii]
As the chart demonstrates, an average curveball usually gets between about 4 and 8 inches of horizontal spin deflection (“sweep”), and about -3 to -9 inches of vertical spin deflection (“drop”). About 10 percent of these pitches (515) had at least -10 inches of vertical deflection. This gives us an idea of what to expect from Coors Field curveballs if the hypothesis is null and Coors has no effect. Below is a graph of all right-handed curveballs thrown in Denver by visiting pitchers during the 2011 and 2012 seasons (N=1,471).
There is a small but visible shift toward zero movement for both the horizontal and vertical axes, as well as a sharp drop-off in the number of curveballs with lots of vertical deflection.[iv] Both the shift in mean deflection and the reduction in high-deflection curves is visible in the following overlay.
The PITCHf/x data used here indicates a Coors Effect of about 1 inch of horizontal movement and 1.5 inches of vertical movement. The width of a bat at the sweet spot is only about 2.5 inches, so every bit of lost movement is a victory for the hitter. Dr. Alan Nathan, an expert on the aerodynamics of a baseball in flight, has hypothesized that one would expect the Magnus effect to have only 82 percent of the impact in Denver that one would expect at sea level, since given equal atmospheric inputs (temperature, humidity), air pressure in Denver is only 82 percent of what it would be at sea level. Dr. Nathan noticed in reviewing some of my early results that the root of sum of squares of the curveball movement was .80, suggesting that atmospheric conditions explained most, if not all, of the variation in curveball spin deflection. Pitch outcomes In order to get a comprehensive view of the success of each pitch type, I have calculated the batting average and ISOs against each type inside and outside of Coors in the 2011 and 2012 seasons.[v] ISO, or isolated power, is slugging percentage minus batting average, a measure of extra-base power. An increase in batting average between two data sets means the ball is being hit more frequently, whereas an increase in ISO between two data sets means the ball is being hit for more power. With that in mind, let us view the data, looking first at batting average.
For pure batting average, the data strongly supports the idea that curveballs lose effectiveness relative to sliders, and that sinkers lose effectiveness relative to cut fastballs. Sliders become by far the best absolute option. Changeups and four-seamers also had significant Coors Effects. Now let’s look at ISO.
Once again, sliders drew a comparative and absolute advantage against curveballs in comparing extra-base power. Interestingly, changeups and cutters suffered the worst effects. The four-seam fastball, meanwhile, was the only pitch type whose ISO increase was significantly less than its batting average increase—meaning that a great deal of the inflated batting average resulted in extra singles. A side note on “whiffs” These trends were not followed at Coors, where the curveball actually had the largest jump in whiff rates compared to the non-Coors numbers from last year. Fastballs and changeups suffered.
There is no obvious explanation for this. There might be a selection bias in who decided to throw curveballs at Coors despite the Coors Effect—maybe only pitchers with good curves dared to throw them in Denver. The ony discernible pattern is that the three pitch types with the most tailing movement were the ones that suffered drops in whiff rate, while the pitch types with the most gloveside movement had improvements. I will leave it for future research to tease that relationship out more fully. Conclusions For the first time, however, PITCHf/x has given us the ability to show that certain pitch types actually are adversely affected by thin atmospheric conditions more than others. There is strong evidence that the slider performs in absolute and comparative terms better than the curveball in Coors Field. Part of this can probably be attributed to the fact that sliders deviate from the “gyroball” trajectory of a pitch thrown in a vacuum the least of the major pitch types. Sinking fastballs also have a sharp drop-off in performance at Coors, and there is some evidence that using a cut fastball would be a good alternative. Rockies management would be wise to learn from failed pitching experiments past. Their system ought to emphasize pitchers developing an arsenal of pitches that could be used effectively at home. This most obviously means encouraging their pitchers to throw sliders instead of curveballs as their main breaking ball, although further study might be able to illuminate what other pitches offer a comparative advantage in Denver. [i] Based on all pitches thrown in the 2012 season (N=676,730). Selection bias caused by mistaken labeling is a risk with this data, but it is minimized by the fact that I’m using manually classified pitch labels. All pitch information is courtesy of MLB Advanced Media and Sportvision, and the manual labels are courtesy of Harry Pavlidis. [ii] Arizona’s Brad Ziegler is an exception to that rule. His data was therefore excluded from this study. I also excluded his teammate David Hernandez, whose slurvy breaking ball appears closer to slider than curveball. Additionally, two pitches thrown by Livan Hernandez and one by Blake Hawksworth were excluded from the Coors Field data set because they were very clearly misread by PITCHf/x (exhibiting anomalous spin and speed characteristics). [iii] Skewness in the distribution of horizontal movement (H mov) was almost nonexistent. Skewness of vertical movement (V mov) was only minutely present—not nearly large enough to warrant further comment. [iv] In the Coors sample, only 15 pitches (1%) had more than -10 inches of vertical deflection. [v] I excluded bunt attempts from this data, unless it resulted in a strikeout. Due to concerns about sample size, I excluded splitters and knuckleballs from this study.
|
The impact on sinkers is basically all batting average; sinkers don't rank nearly as bad when you look at ISO. So maybe the Rockies should get sinkerballers and a competent infield defense!
How does this jive with other recent BP research that sinkers and sliders both eat pitchers' arms for lunch? Should the Rockies just churn-and-burn their pitchers and not even expect to get 6 years of control out of them?
Sinkers might be a more effective strategy at Coors than in some other parks. Sinkerballers will give up lots of hits since they are putting balls on the ground more often, but theoretically fewer of those hits will be home runs.
I'm not an expert on keeping pitchers healthy, but from what I understand there's really only a major risk of arm injury when a pitcher throws a slider REALLY often, like more than 40% of his pitches. My suggestion is to use the slider, instead of the curveball, as the primary breaking ball in their arsenal. Most pitchers throw enough fastballs that it shouldn't present a problem.