.png)
.png)


 7 comments have been left for this article.
 BP Comment Quick Links

|

|
December 21, 2012 Overthinking ItThe Mike Minor Mystery
Through his first four starts and 26 1/3 innings of 2012, Braves starter Mike Minor allowed one home run, striking out 21 and walking five. He had a 3.42 ERA, and the Braves were 3-1 when he pitched. Then came his next six starts. In those six starts (four of which Atlanta lost) and 31 2/3 innings, Minor still struck out 30, but he walked 16 and gave up 12 home runs—as many as Tim Hudson allowed all season. Minor’s outings got so ugly that on May 21st, after the fifth of those sixth starts, Fredi Gonzalez defended him—sort of—by saying, “he only gave up four solo home runs.” The next day, Atlanta Journal-Constitution columnist Mark Bradley wrote a post entitled, “Numbers suggest Minor hasn’t been quite as bad as all that.” In that post, Bradley pointed out that Minor “has, at least according to one key stat-geek metric, pitched almost as well as Brandon Beachy.” Beachy, at the time, led the majors with a 1.33 ERA; Minor’s ERA was 6.96. Predictably, frustrated Braves fans left 100-plus comments helpfully suggesting that stat geeks start watching Minor’s starts instead of their spreadsheets. Through that point of the season, there was one obvious difference between Beachy and Minor*: very few of Beachy’s fly balls had left the ballpark, while many of Minor’s had (roughly 28 percent over those six ugly outings, or about three times the league-average rate). The stat Bradley based his post on was xFIP, a spin-off of FIP that replaces the actual percentage of a pitcher’s fly balls that left the ballpark with a league-average rate. xFIP assumes that a pitcher who’s allowed more homers than his fly-ball rate indicates has been “unlucky” and adjusts his stats accordingly, penalizing him only for how many homers he “should” have allowed. But just as some pitchers consistently allow low BABIPs and beat their FIPs, some pitchers consistently allow a higher-than-league-average rate of home runs on fly balls, either because of the way they pitch or because of their ballparks. For them, xFIP is deceptive, like Spanx for pitching stats. It makes their lines look less bloated, but it can't remove the bulges beneath. *Actually, there were a couple other important differences: Minor also had a higher BABIP and an awful strand rate (because he’d pitched poorly with runners on base). I’m just focusing on the homers here. At that point in the season, Minor’s and Beachy’s xFIPs were almost identical. The question was whether Minor had been the victim of bad luck on fly balls—in which case his 3.82 xFIP was a better reflection of how he’d pitched—or was doing something to make himself more susceptible to homers. In his first two partial seasons, Minor hadn’t shown any tendency to give up more homers than expected (for a fly-ball pitcher), which suggested bad luck might be to blame. Still, 12 homers was a lot to wipe away with one stat. Everything after May made Bradley (and xFIP) look smart. In the five subsequent starts Beachy made before Tommy John surgery ended his season in June, he allowed five homers and recorded a 3.33 ERA. In Minor’s 20 remaining starts, the lefty allowed 13 homers (just under one per nine innings) and posted a 2.74 ERA. Minor’s improvement was overshadowed by Kris Medlen mania, but he was one of the best second-half starters in baseball. When a player does something out of character, either for himself or for the league (or both), we usually predict that it’s going to regress, just like Minor’s home-run rate. But not all regressions are the same. In some cases, a player is doing everything right, but the results are all wrong—the classic “hitting line drives right at people” problem. Given enough time, that one sorts itself out. But sometimes a player who appears to be struggling is truly playing poorly: he’s too aggressive, or his timing is off, or his approach is otherwise flawed. So he does something about it: he takes extra BP, or talks to a coach, or watches old video, or does anything other than what wasn’t working before. He takes an active role in his regression, and maybe he makes the change in results come more quickly. So which kind of regression was Minor’s? I’m going to give you three possible explanations for his improved results. Your mission is to pick the one you think makes the most sense. 1. Minor mixed up his pitches.
That makes sense, right? When hitters can count on seeing one of two pitches, neither of which has any bend to it, they’re going to feel comfortable at the plate (especially when one of the two pitches isn’t working well). And when hitters feel comfortable, pitchers should feel afraid. Without repeating what Minor said about that start, I asked one scout who saw him regularly last season to identify the difference—if there was one—between the guy who got shelled in May and the guy who posted a 0.87 ERA in September. Here’s what he said:
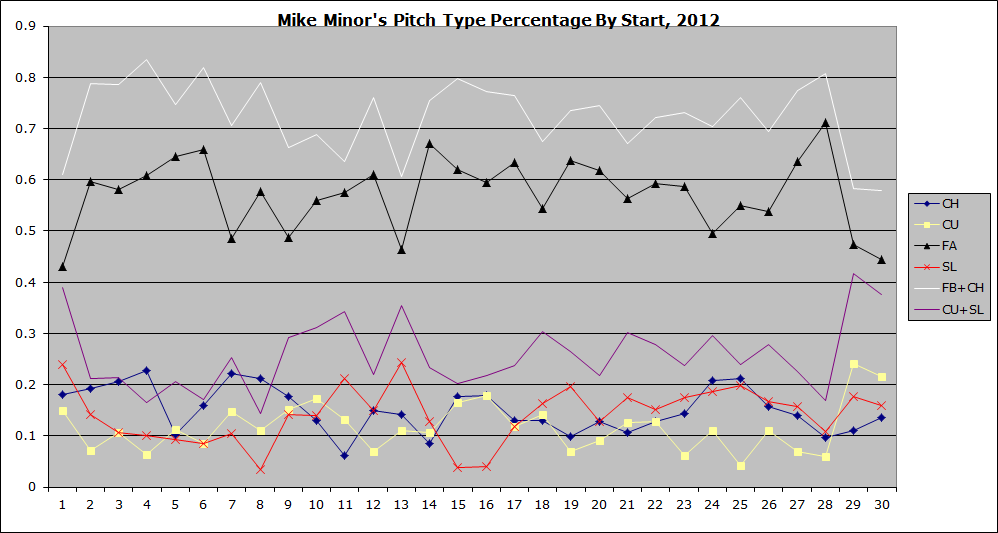
Sounds plausible, but is it supported by the stats? Here’s Minor’s pitch usage by start, courtesy of Harry Pavlidis (click to expand):
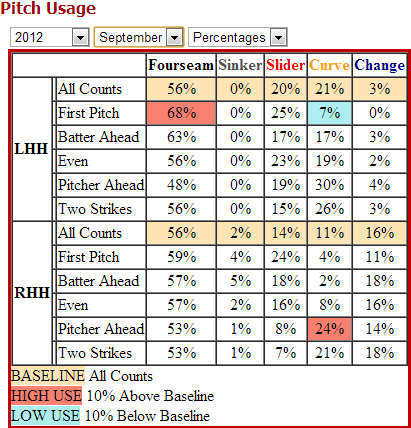
The graph doesn’t show much of a change. Minor used breaking balls more often in his last two starts, but he also used them more often than average in his ugly ninth and 10th starts. All told, he threw curveballs or sliders 23 percent of the time during his disastrous six-start stretch and 27 percent of the time thereafter. As the scout said, though, it’s not just how many breaking balls he threw that matters, but when he threw them. Here’s his pitch breakdown for May, when he allowed 10 home runs, and for September, when he allowed one:
In May, Minor was predictable. All 10 of his homers allowed came on four-seamers or changeups. Nine came against right-handed hitters, and six came with two strikes. In May, Minor threw four-seamers and changeups on 81 percent of two-strike counts to righties; in September, that rate fell by 10 percentage points, as he threw curves with two strikes almost twice as often as he had earlier in the year. So while righties were able to look fastball or changeup and go on the offensive in May, even when they were behind in the count and should have been worrying about protecting the plate, the curve gave them something else to think about in September (and yielded almost 50 percent more whiffs than it had before). From April through June, right-handers batted .272 against Minor, slugging .523 with 15 homers. From July through September, they hit .186 and slugged .285 with four homers. Minor might also have gotten better at avoiding repeat pitches. Of the eight homers that weren’t hit on the first pitch of an at-bat during those six bad starts, three came on a second consecutive changeup, three more came on a second consecutive fastball, and the other two came on the second changeup of an at-bat. The home run he allowed to Drew Stubbs in the fourth inning of his May 21st start (the third homer of that frame) came on the seventh pitch of the at-bat—and the seventh consecutive fastball. So maybe that’s what “learning how to pitch” means: learning not to throw seven consecutive fastballs to someone who struck out in over 30 percent of his plate appearances. 2. Minor’s fastball became a better pitch.
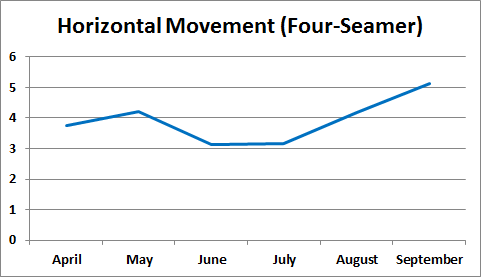
Jeff doesn’t say what his data source was, but presumably it was raw PITCHf/x info from MLBAM. Here’s Minor’s fastball velocity and horizontal movement by month using data from Brooks Baseball:
Jeff is right that Minor’s velo and movement picked up at the end of the season, but look at the magnitude of the change: the difference between his lowest-velocity month and highest-velocity month is less than one mile per hour, and without accounting for differences in PITCHf/x calibration between parks, we can’t even be confident in that. Minor’s velo in his worst month of the season, May, was essentially the same as it was in his most successful month, September. His fastball moved an inch more in September than it did in May, but according to a 2010 article by Mike Fast, “shifts of two to four inches due to errors are fairly common.” Plus, some 2009 research by Dave Allen suggests that horizontal movement for four-seam fastballs might not matter much anyway. Minor’s fastball whiff rate did dip in May, but his velo and movement didn’t drop until June. There might be something here, but it seems like a stretch to blame Minor’s brief-but-severe bout of gopheritis on his heater. 3. Minor’s luck improved. But early in the year, the percentage was much higher: seven of Minor’s 13 home runs over the first two months, and six of the 10 hit in May, just got over the wall. Only three of the 13 hit from June through September were close calls. As he left May further behind him, Minor’s percentage of “Just Enough” homers and fly balls that left the ballpark gradually fell from season-destroyingly high to barely above league average. Here are the three flukiest homers hit against Minor: 3. Yamaico Navarro, April 30th
Minor missed his target by most of the strike zone, so this pitch didn’t really deserve a happy ending, but it ended up low and inside, produced a strange-looking swing, and barely cleared the fence. This home run broke a streak of 85 homerless plate appearances for Navarro, but it wasn’t the longest home-run slump busted by Minor last season. Minor also gave up Mike Leake’s first career homer, the only homer Emilio Bonifacio hit in in 2012, and three of the six homers Ryan Howard hit against southpaws. Allen Craig, May 11th
Minor didn’t really do anything wrong here. He just about hit his target—if he missed it at all, it was off the plate, which is where you want to miss, assuming you have to miss somewhere. Craig hit it out anyway, by a few feet. Minor just threw this pitch to the wrong person. Jose Reyes, June 7th
This was the second-highest pitch hit for a homer in 2012, 4.16 feet off the ground, and the highest relative to batter height. Not only should it have been way too high for Jose Reyes to hit for a homer, especially in Miami, but it bounced on the top of the outfield wall, as if to emphasize its improbability. This picture and the GIF that preceded it are the embodiment of Minor's bad luck.
Minor probably deserves to have this earned run stricken from his record, along with several other runs as compensation for the pain and suffering he endured while watching this pitch leave the park. (More evidence in favor of the “luck” explanation: Minor had a .228 BABIP after May. Then again, less predictable pitch patterns might have led to weaker contact, as the anonymous scout said.) So, which was most responsible for Minor’s second-half success: more mixing of pitches, better fastball, or better luck? (Or something else entirely!) Did Minor stop serving up hits and homers because his luck turned and more balls began to find gloves? Or did he succeed because he started doing things that were more likely to lead to outs?
Ben Lindbergh is an author of Baseball Prospectus. Follow @benlindbergh
|
As someone who watched Minor pitch all year, I always felt the luck and pitch sequence explanations were the best ones. Good job sifting through the data to examine it. One other idea: it seemed that too many of Minor's "mistake" pitches found the middle of the plate in the early part of the season. After June 1, he seemed to miss low or out of the zone more. Can that be easily verified or refuted with pitch f/x?
Not exactly "easily," but yes, that's a question PITCHf/x could help us answer.