


 5 comments have been left for this article.
 BP Comment Quick Links

|

|
December 13, 2012 In A PickleWinners and Losers of Winning and Losing
Psst. I've got charts. You want charts? C'mere. Look. Look at this chart.
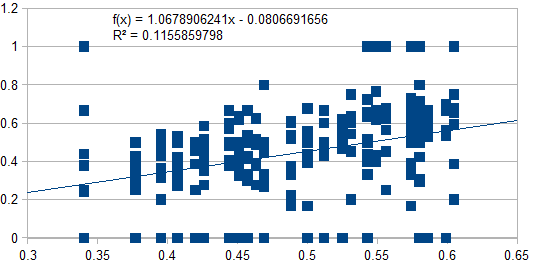
You like that? Oh, you don't know what that is? I should have put axis labels. Each dot represents a starting pitcher who pitched for just one team in 2012. (The restriction is because I'm bad at doing spreadsheets and databases, not for any research design reason. As you'll see, I'm not doing rigorous work, so this doesn't really matter.) On the x-axis is the overall win percentage of that pitcher's team. On the y-axis is the win percentage of the pitcher's team in his starts. (I would be happy to hear your arguments that I should have flip-flopped these axes. I mean that. I couldn't decide which of the variables I was treating as the dependent one.) It's kind of a stupid chart, though. Why is it a stupid chart? Mainly because it includes a bunch of pitchers who only started once or twice or thrice, which junks things up. Let's try this again.
That's better! That's pitchers with at least 10 starts on the season. Look at that r squared—I almost tripled it! That's a nice, attractive fit (as baseball fits go) between whether your team wins games and whether your team wins games that you pitch. Here, have one more before I get to the actual point.
This is all pitchers again, not the pitchers with at least 10 starts. The x-axis is FRA, our basic pitcher-value stat. The y-axis is the difference between a pitcher's team's win percentage in his starts and the team's overall win percentage. (Given that high FRA appears to be correlated with a low delta, you can probably tell which direction I subtracted.) From these three charts we can draw three related conclusions:
That's as advanced as I get about the nitty-gritty of analysis and charts and stats and such. If I could say whether the "findings" above are statistically significant at some level, I would, believe me, but I can't, so instead let's get to the real point, which are these guys:
And these guys:
Ready to guess who those seven players are? (I know, there are two players inside one of the stars in the second graph, but the other one isn't supposed to be there. He's an interloper. Just ignore him.) Kris Medlen Is Atlanta to be forgiven for not realizing that Medlen's return from Tommy John surgery would go quite this swimmingly? (How swimmingly? This swimmingly: 3.37 FRA, 120 whiffs in 138 innings, other stats as well.) Here's a PITCHf/x tidbit from the awesome leaderboards: minimum 200 pitches, among starters, no pitcher got more swings on his changeup than Medlen, and just two got more whiffs per swing. Those two were Stephen Strasburg and Cole Hamels. One notes that Medlen is still just 27. Jamie Moyer Moyer had a superficially good April, posting a 3.14 ERA in five starts. He managed to give up five unearned runs, though, so his RA/9 was 4.71. (The earned/unearned distinction deserved to die along with our regard for saves and wins and RBI as measures of value, by the way, a fact I'm likely to shoehorn into every article I write here until we all stop using it.) That RA/9 is not horrendous for the oldest pitcher in memory throwing in Colorado in front of a defense that wound up with the lowest defensive efficiency and the lowest park-adjusted defensive efficiency in baseball by a huge margin—as an illustration, the gap in DE from Colorado to the 29th-best defense is the same as the gap from 24th to 11th. Moyer gave up just one "unearned" run in May. Unfortunately, he allowed 24 "earned" ones in 25 innings. One suspects that the only thing keeping him from having an even worse June is that Colorado released him. Moyer latched on with the Orioles and Blue Jays, but didn't pitch in the majors with either. He wouldn't have pitched better, mostly likely, but he wouldn't have left his team with losses in 20 percent of his games, either—give Moyer enough starts and he might well have pitched his way right out of outlier status. Factoid: Moyer averaged under 80 mph with his fastball in 2012. To reiterate: Moyer threw about as hard as a good adult-leaguer and still managed a 90 FRA+ in the major leagues. (FRA+, for the record, is like ERA+ but with FRA as the base stat. As you probably guessed. And no, a 90 FRA+ isn't All-Star territory, but it's perfectly respectable and not "why on earth would they even let him play"-level pitching.) One wonders whether baseball is not actually as hard as everyone claims it is. Randall Delgado One would be forgiven for pondering whether Delgado's service time (which currently stands at 165 days—it takes 172 to make a full year) might have something to do with his demotion. Edwin Jackson Jackson is entering his age-29 season and has pitched for seven different major-league teams in his career. By sheer operation of odds, there's at least a decent chance that he won't make it number eight next year. (A seven out of 30 chance, maybe. But not really.) One only hopes that Washington's refusal to support Jackson doesn't cost him any dollars on his free-agent contract. Julio Teheran One should just leave things there because one would not want to force one's schtick when one has nothing else to say. Shelby Miller Anyway, Miller, like Teheran, made one start and had an FRA that commences with the numeral two. (Then a dot.) The difference is that the Cardinals won Miller's start, a six-inning, one-hit affair on the last day of the regular season. Miller also doubled Teheran's innings overall, throwing 13 2/3 over six appearances and just once allowing a human to touch home plate in a way that benefited that human's baseball squad. (That means "scored a run." No, I can't just say that.) One has, to the relief of all and sundry, given up on one's thematic third-person game-playing by this point in the article. Aneury Rodriguez One is through. Really. For what it's worth, and you'll have to make do without a graph on this one, here are a few notable outliers among players with a more substantial number of starts:
I'd like to sum up with a grand unifying theme, one that shakes the foundations of sabermetrics to its core: I've found pitchers that just know how to win and pitchers that aren't winners. Right? No, of course that's not what I've found at all. I've found hard-luck guys and small-sample guys and one guy who just happened to be literally unbeatable, which is another way of saying that I've found what you'd find every year if you went through an exercise like this. I'd like to think this is not valueless, though, as the suggestion that team wins and losses are relatively closely but still far from wholly related to individual pitching is something that can stand to be reconfirmed every once in a while in a non-polemical, non-shouty way. Especially since we may be on the cusp of Jack Morris gaining entry to the Hall of Fame. Cough.
Jason Wojciechowski is an author of Baseball Prospectus. Follow @jlwoj
|
Terrific article, but I'm not sure how much of an outlier Jaime Garcia really was. His home-road splits are dramatic: 3.01 xFIP at home, 3.40 on the road.
I don't know how that translated to wins and losses for the Cards, but it was something the fans and media talked about every time he lost on the road.
First, this depends on your choice of metric. Garcia actually had identical FRA at home and on the road.
Second, I think dramatic oversells it. The league put up a 3.90 xFIP at home and 4.14 on the road. An extra 0.15 runs (or "runs" I guess since we're in estimator territory) doesn't strike me as a big deal.
In any case, a 3-8 road record vs. 5-4 at home does explain, in a sense, why his team's record was so bad when he pitched, but limiting him to the road still makes him an outlier -- a 3.40 xFIP is excellent! You'd expect a very good team like the Cardinals to go more than 3-8 when their starter gives them a 3.40 xFIP.
Thanks Jason. You're right that I wasn't considering league-wide context. Still, if you were a Cardinals fan who watched some of those games ...