


 11 comments have been left for this article.
 BP Comment Quick Links

|

|
June 25, 2012 Collateral DamageThe Year of the Injuries?
With the emphasis being placed on injuries, it’s no wonder why some people are running around like Chicken Little screaming, “The sky is falling!” Headlines scream about injuries and range from “The Year of the Injury Plagues MLB” to “Baseball’s Biggest Stars are Hurting.” How hard and fast the sky is falling depends on the team you root for. If you live in New England, surely you have heard at least some fans making excuses about the Red Sox’ record because of the high number of DL moves. If you cheer for the White Sox or Marlins, injuries probably aren’t being brought up too much. So, who is right: those that say that the sky is falling, or those who shrug it off, understanding that Chicken Little is simply over exaggerating? I mean, could it really be that bad across Major League Baseball? There has to be a reason though why 2012 seems like it’s been a bad year for injuries. In order to get an idea of what’s going on, I went back and looked at all DL moves between 2005 and now. I also looked at why players were placed on the DL for. What’s the injury that pops into your head when you hear a pitcher gets injured? Tommy John Surgery (TJS) is probably one of the top two, so let’s start our focus there.
Clearly, TJS is up significantly this year and is probably the biggest contributing factor in our perception behind a rise in injuries this year. So far in 2012, there have been more Tommy John surgeries through June than any in any other year. Several other players—Felipe Paulino, Drew Hutchison, Kyle Drabek, Neftali Feliz, and Kyle McClellan to name a few—are either scheduled for TJS or rehabbing from a sprained ulnar collateral ligament. In fact, there have already been more surgeries in 2012 than any other full season; 2007 was the closest, with 21 surgeries for the entire year. Right now, I don’t have a concrete explanation as to why 2012 became the year for Tommy John surgeries. There was no work stoppage during the offseason like in the NBA, and there wasn’t a particularly cold spring to cause the muscles to become more stiff and unable to withstand the forces of pitching. Tommy John isn’t getting any kickbacks for the surgery as far as I know. One factor that likely plays a role though is velocity. High maximal pitch velocity has been linked with elbow injuries, and our Tommy John group from 2012 averaged over 94 mph on their fastballs. For comparison, the average across the majors has stayed a consistent 92 mph over the last several years. Now, it doesn’t sound like a huge difference, but remember that it includes all pitchers, even Jamie Moyer. In our TJS group, only George Sherrill averaged less than 90 mph. TJS accounts for only a small amount of the total injuries; 22 TJS out of over 300 DL moves is about seven percent of the total injuries. Has the total number of injuries really increased over the years, though? Let’s look at the simple but big one, the overall number of DL additions through the end of June.
Despite the hysteria throughout the country, we can see in 2012 that there has not been an increase in the number of injuries across the board. In fact, unless we have 20 players ending up on the DL over the next week or so, it won’t even rank in the top three since 2005. The perception that the number of injuries is increasing at an alarming rate is simply not true. So what is it, then? Why are so many people everyone freaking out about how injuries are devastating this year? The answer lies in what teams you are looking at and/or what injuries you are looking at.
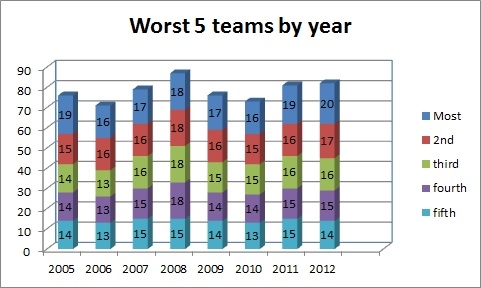
This “worst of the worst” graph represents the highest number of DL moves on a team in each year through the month of June. Other years have been close with 19 (Washington in 2005 and Los Angeles Dodgers in 2011) but the Boston Red Sox have the highest number in 2012. That stinks for the Red Sox—or karma, depending on how you look at it—but it could just be they are the ultimate outlier and skew the perception. To get a better idea, we need to get a bigger sample and look at the five worst teams (16 percent) for each year and see how the totals compare.
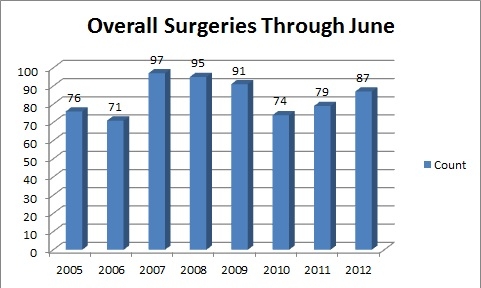
By using multiple teams, we can get a better idea if the injuries truly are getting worse across the league. When comparing the previous graph to this one, we see a different story. The 2007 and 2008 seasons now fare just as poorly, if not worse, than 2012, while 2011 still ranks just a hair below 2012. Digging a little deeper, by removing the worst team each year and focusing only on teams two through five, 2007 is now tied with 2012 with the same number of DL moves and 2009 is only a smidge behind. So what about injury severity? Counting numbers alone don’t tell the whole story. Injury severity has to factor into the picture as well because injuries that require surgery usually have a greater impact on the team than calf strains, for example. There may actually be something to that. This next graph looks at the overall number of surgeries through June.
Even including TJS, 2012 does not live up to the hype; 2007 through 2009 were all worse than 2012 in terms of the overall number of surgeries. This list includes all surgeries, including Tommy Johns. Excluding Tommy John surgeries from the list, we see an even greater difference.
So where does this all lead us? The only apparent difference is that Tommy John surgeries are up this year. The overall number of DL moves is down, the number of surgeries other than Tommy John surgery is down, and the number of DL additions for the worst 17 percent teams is essentially level for the last several years. Finding out the root cause for the increase in Tommy John surgeries is difficult. We have mentioned that increased velocity is linked with elbow injuries, but there was no significant difference in our Tommy John group over the last three years. Strength and conditioning practices have not suddenly changed to cause the increase. Teams haven’t suddenly gone to a three-man rotation or allow players to throw 170 pitches. More research needs to be done, but don’t be surprised to see a few more TJS throughout the rest of the year. At least we have some explanation for why it seems like injuries as a whole are up, even when the evidence points in the opposite direction. --- Editor's note: The injury totals in this article are through Friday, June 22.
Corey Dawkins is an author of Baseball Prospectus. Follow @CoreyDawkinsBP
|
Thanks for the breakdown. I suspected the TJS incidents were "up" but the rest of the story had escaped me.