 10 comments have been left for this article.
 BP Comment Quick Links

|

|
May 30, 2012 Manufactured RunsWho Gives a Shift?Let’s play a game called “Which one of these is not like the others?” Culled from Fangraphs, Baseball-Reference, and yours truly, defensive ratings for Brett Lawrie:
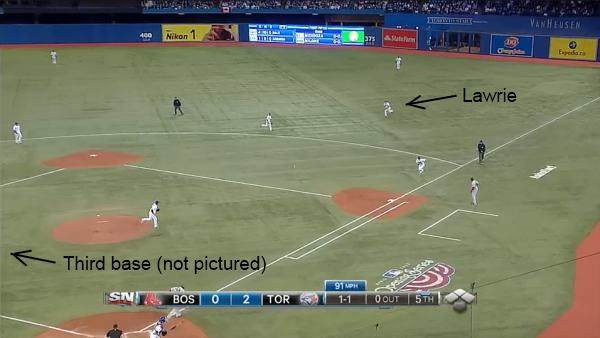
So. Let’s say that UZR, TotalZone, and FRAA all give Lawrie credit for seven runs. That’s 14 runs saved that DRS credits Lawrie for that none of the other metrics do. The difference between DRS and the field is double the number of runs that the other metrics assign to Lawrie. The two metrics that are most comparable in this case are DRS and UZR, as they both rely on the same batted ball and hit location data provided by Baseball Info Solutions. So how do the two metrics come to such radically divergent views of Lawrie’s defense? The new “new Moneyball” is putting your fielders in really weird places. In Lawrie’s case, the Toronto Blue Jays are employing a new kind of shift, where the third baseman is the only fielder to shift, and boy does he shift—all the way into short right field. An example:
We don’t have to speculate that this shift is affecting his defensive rating—Baseball Info Solutions confirms as much in a May 11th article (which, for reasons I cannot fathom, calls DRS DSR and BIS BSI and Jedlovec Jedlovic): A significant factor in the Jays' top DSR rating is their frequent use of an over-shift against notorious pull hitters. Through May 3, Toronto had used a shift 47 times and saved eight runs as a result, [BIS research analyst Ben] Jedlovic [sic] said. Five of Lawrie's 12 runs saved came when he moved to short right field in a shift against a left-handed batter such as David Ortiz or Carlos Pena. Those three bunt singles that Pena dropped toward third base against the shift on April 17 at the Rogers Centre? They hurt Lawrie's plusminus rating. The DSR formula credits him for being in the right spot on the shift, but penalizes him for abandoning his post when Pena foils the shift with a bunt. Another respected defensive metric - Ultimate Zone Rating (UZR) - also uses BSI's data but does not give credit for runs saved by shifts. Jedlovic said some defensive experts believe good coaching and strategy are more responsible for runs saved by shifts than player performance. But BSI believes in crediting the player. "We've elected to leave it in there because it shows that when guys are shifting, they're saving runs for their team," he said. So the plays Lawrie make “save runs for the team,” by DRS’s reckoning. But do they really? And (more importantly) are they saving as many runs as DRS says they are? (And why are FRAA and TotalZone, metrics which do not exclude shift plays, not crediting Lawrie for the extra shift plays that DRS seems to?) First, we want to know how many plays Lawrie has made while in this shift. BIS does not, to my knowledge, publish such information through Fangraphs, Baseball-Reference, or Bill James Online. BIS gets their data by watching telecasts of games, though, so anyone with an MLB.tv account and a goodly chunk of spare time can replicate their methodology. In order to make the task manageable, I used our database to produce a list of all at-bats by a left-handed hitter where the ball was fielded by Lawrie. Then I watched them. And I counted how many times Lawrie fielded the ball in short right field (I ignored any plays where a more conventional shift may have been employed, although I believe there were only one or two of those anyway). And now, the results of that trial:
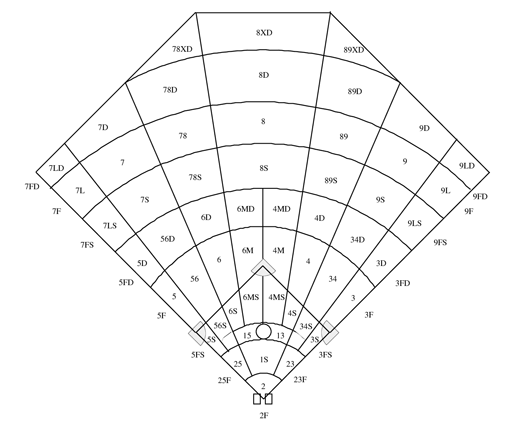
Shifts is number of at-bats where Lawrie fielded a ball from the shift, shift plays is the number of plays made (defined as a putout or assist) on those balls, and IF shift plays is any time a play was made on a ground ball. Maybe BIS’s totals are a little different than mine, based on how they classify “shifts” and “ground balls” and such, but it should be pretty close. So depending on how BIS counts those non-GB shift plays, that’s roughly 12-16 plays for Lawrie in the shift, plays we know that UZR is ignoring. Since DRS is denominated in runs and not plays, Lawrie would have to be getting credit for darn near a whole play above average for each of his shift plays for this to explain the bulk of the difference between DRS and UZR (which, again, gives Lawrie zero credit for any of his shift plays). Do we think that DRS could be doing this? And do we think that DRS should be doing this, if so? Here’s what The Fielding Bible Volume III has to say about the methodology behind the Plus/Minus ratings, the part of DRS that deals with fielding balls in play (it’s on page 441, if you want to follow along): Let’s say we’re watching a Dodger’s game, and Matt Kemp is patrolling center field. We might estimate that a particular play is made by the league’s center fielders 42 percent of the time… If Kemp makes this play, it’s a nice play. A sizable 58 percent of center fielders did NOT make this play. We reward him for this; specifically, we reward him 0.58 Basic Plus/Minus points (or “plays”). If Kemp does not make the play, we penalize him according to the proportion of fielders who did make the play, 0.42. In this case, Kemp would get -0.42 Basic Plus/Minus points on the play. Please note carefully—the estimate is made of what percentage of center fielders would make the play on the ball in play, given the input parameters. The Fielding Bible also notes that: A play is considered “not made” when the fielder doesn’t get a putout or assist on the play AND no other fielder had the first putout, assist or error. For example, if the third baseman fields a groundball towards the third base/shortstop hole, we don’t count this play for or against the shortstop. We assume that he didn’t have an opportunity to make the play and award no credit or penalty. So let’s play around with this basic framework and see how far it takes us. It helps to have some sample data to play around with. Again, we don’t have access to the raw data underpinning DRS. For the purposes of illustrating this point, however, any zone data should do, and the most convenient source of that is from Project Scoresheet. This is what the Project Scoresheet field diagram looks like:
I have consolidated the “S” and “D” zones with the primary zone, so for instance 5D is lumped in with 5—this way we pay attention only to the horizontal spray angle of the data. So here are third baseman play made rates on ground balls for each of those zones, from 1995 (no particular reason for that year):
Shockingly, you see most of the plays made in the zone where the third baseman stands, fewer in the hole, and then almost no plays in the remaining zones. (We can talk about how range bias affects this, but for the purposes of this illustration, it shouldn’t matter much.) So let’s say that there’s a grounder hit through the 34 zone, and Lawrie makes a play. Given these estimates, Lawrie would get credit for one play made, less the 0.0022 probability that a third baseman would make that play, or 0.9978 “Plus/Minus points.” What this ignores is that Lawrie is not the only infielder. What’s the probability that any infielder would have made that play?
In the particular shift the Jays are playing, you may note that Lawrie can get to only balls that have already passed by the other infielders. This is true, but the other infielders are positioned based upon knowing that Lawrie is backing them up in short right field. (And on one play, I noticed the first baseman giving up on a ball and heading back to cover first because Lawrie was going to be able to field it as well). Those balls that Lawrie is fielding from short right field are not the nearly-certain hits that you would assume from comparing Lawrie to a baseline of all third basemen, most of whom aren’t fielding balls in that position not because of a lack of skill but because they’re standing by third base. This analysis would suggest that, instead of measuring how many additional plays made at the team level the shift is contributing, it’s measuring how many additional plays are contributed to Lawrie by the shift, crediting him for some plays that other fielders would have made in a more traditional defensive alignment. How many extra plays the Blue Jays are making as a team due to the shift is a more complicated question, which I’ll attempt to examine at a later point. It seems much simpler to see how the shift is distorting the Plus/Minus ratings. There are, I think, two larger points at work here. One is that seemingly trivial details can have large impacts on the results of “advanced” fielding metrics. Even if we had the BIS data at the root of DRS and UZR publicly available, it’s not clear that we’d be able to duplicate either metric. And without some sort of standard to determine the validity of fielding metrics, there are cases in which it isn’t clear which fielding metric (if either) has made the correct decision. The other is that what we should be attempting to measure with fielding metrics is not a player’s extra plays relative to his positional peers, but how many extra plays he is contributing to his team. This is an extreme example, but there are many more subtle interaction effects between fielders, and it is not clear that hit-location-based systems have any advantage in recognizing those effects (in this particular instance, it seems to put them at a distinct disadvantage). Obviously, comparing a fielder to his positional peers is one important part of such metrics, but we need to take care to reconcile such things at the team level, as well. As a special bonus, raw data on the plays examined for the article. Enjoy.
Colin Wyers is an author of Baseball Prospectus. Follow @cwyers
|
I never understood Dewan's reasoning for measuring shift plays the way the do. However, how does FRAA do it. I think you say that FRAA does not simply leave these plays out similar to UZR. Do you simply add it in to the pool of plays a third baseman makes in comparison to other third basemen. Does FRAA compare it to plays a second baseman makes given the positioning is closer to their typical zone?
FRAA doesn't do anything different for shift plays than it does for any other plays - it counts all his plays as plays made, and figures his expected plays made based on team fielding performance. There's no location data, so it doesn't treat a play made over by the third base line any differently than one made in short right field.
Interesting. I'm somewhat of a novice on defensive metrics. Is there a primer somewhere on the differences / pros and cons of each of the four methods you used?
The Hardball Times Forecasts has Lawrie at +5.8, right in line with all the non-BIS ratings. Although there are differences in the details, everything Colin just said about FRAA applies to my defensive metrics.
I'm of the opinion that for this kind of shift, with the third baseman in short right field and everyone one else in fairly normal positions (the Pirates have also been doing this) it might be better to not include these plays in the third base ratings, instead creating a new position. I don't want to ignore the shifts, but the calling the guy in short right a third baseman is really making things difficult.