


 14 comments have been left for this article.
 BP Comment Quick Links

|

|
April 3, 2012 The ProcessWhich College Programs Have Produced the Most Value?
Among pitchers who have debuted since 1965, three of the five best career WARP totals belong to players drafted out of the collegiate ranks. Former Texas Longhorn Roger Clemens leads the way with 103.4 WARP earned over 24 big-league seasons, followed by ex-Southern Cal star Randy Johnson (90.7). Prep hurlers Greg Maddux (83.9) and Steve Carlton (73.4) take the third and fourth spots, and another former Trojan, Tom Seaver (72.9), rounds out the top five. While schools like Texas and USC are well known on the national stage, successful baseball programs can claim significant credit for increasing the profiles of several less-familiar colleges and universities, including Pepperdine, Cal State Fullerton, and Long Beach State, three schools lacking the profile (and revenue) associated with Division I football programs. Using wins above replacement player, it is possible to determine how much major-league value each program has delivered through the draft. Throughout the rest of this article, we'll explore multiple ways of looking at the value returned by each program with the goal of identifying a single fair and accurate number that represents the value each program has produced.
The Data
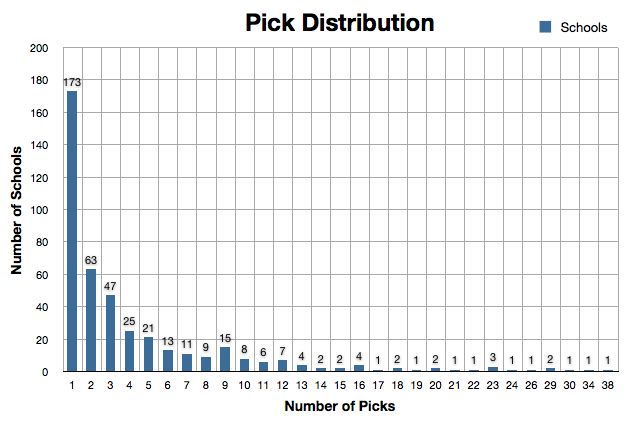
Three programs—Arizona State (38), Texas (34), and Southern California (30)—featured 30 or more picks in the study, and a total of 14 contributed 20 or more. Predictably, the five most common pick totals were one through five, but the sixth-highest count was nine, seen 15 times in the study. The data utilized in the analysis that follows is drawn from the first 10 full professional years of each player’s career. For example, statistics attributed to Jamie Moyer, whom the Cubs selected in the sixth round of the 1984 draft, are only those accrued between 1984 (year zero) and 1994 (year 10). Though we’ll refer to these figures as 10-year totals throughout this article, it is possible for players to have 11 seasons' worth of data included in their 10-year totals. This happens when players reach the major leagues in the same year they are drafted (year zero), such as when Greg Swindell made nine late-season starts for Cleveland less than three months after the Indians made him the second-overall pick in 1986. Going forward, all statistics appended with “10” are 10-year totals. One final note regarding the data you’ll see in this article. Taking a cue from Rany Jazayerli, I’ve opted to zero out WARP totals for players who reached the major leagues but accrued below-replacement level WARP. Quoth Rany:
Determining Value The most obvious, and least-telling, method is to simply sum all of the WARP10 earned by each program’s players. Total WARP10 Returned by Program
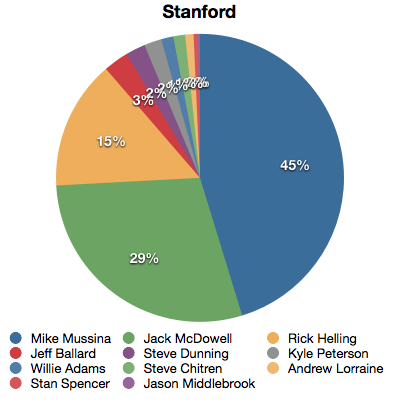
If you read the introduction to this article, it shouldn’t be much of a surprise that USC and Texas top all programs in WARP10 returned with 119.26 and 115.13, respectively. After the top two, there’s a significant drop-off to the third-ranked program, Pepperdine (72.69), and another sizable gap is found between the sixth (Arizona State, 54.74) and seventh (Louisiana State, 42.80) schools. While total WARP10 is a quick and easy way to stack programs up against one another, is it a reliable way to determine the overall value of a program’s contributions to the major leagues? USC received 63.6 percent of its total WARP10 from the two players referenced earlier, Tom Seaver (48.12) and Randy Johnson (27.76), and 96.8 percent from those two plus Barry Zito (22.96) and Mark Prior (16.68). Similarly, Roger Clemens accounts for 41.3 percent of Texas’ total WARP10, and only three other Longhorns contributed more than 3.5 WARP10. Things fall off abruptly for Stanford who, despite being anchored by two of the top-25 pitchers of the 1990s in Mike Mussina and Jack McDowell, produced only one other pitcher (Rick Helling, 10.31) worth more than two WARP10 from among their 16 non-Mussina/McDowell picks to reach the major leagues.
Three of the top four schools received 40 percent or more of their total WARP10 from a single player. We’ll investigate the benefits and drawbacks of quantity and quality a little later. Number of Above-Replacement Level Seasons Returned by Program
Eight of the top-10 programs in WARP10 also rank among the ten schools that produced the most above-replacement level seasons (ARP10) in the study. This is a fair way to gauge which programs produced the most major league-caliber players. Replacement-level players aren’t what clubs are mining for in the top 10 rounds of the draft, however: they’re looking for franchise cornerstones, stars, and above-average major-league contributors. For this study, the average level of pitcher performance was determined by averaging the seasonal WARP earned by all pitchers who threw 75 or more innings during the regular season (view each year’s average here). An above-average season is credited to a pitcher whose seasonal WARP is greater than that season’s average WARP. Number of Above-Average Seasons Returned by Program
Reviewing gross totals is a convenient way to determine which programs have produced the most overall value, but, as you’ve seen, there’s a correlation between the number of players drafted from a program and that program’s value returned.
Another way to look at this data is to find the average value returned per pick. For example, if we sort the data in the ARP10 table above by ARP10 returned by pick, the rankings change significantly. Texas (1.59) drops from the top of the list down to eighth, and Auburn (2.75) jumps from seventh to first. Louisiana State (2.57) stays put at number two, but third-ranked Arizona State (1.34) falls seven spots and brings up the rear. A total of 99 schools (23.1 percent) in the study had 10 or more players selected. When we include them, the number of programs that returned at least 2.00 ARP10 per pick increases to 10: Average Number of Above-Replacement Level Seasons Returned by Program, Per Pick
Similar results are seen when we re-sort the data in the AA10 table by AA10/Pick: Average Number of Above-Average Seasons Returned by Program, Per Pick
Finally, let’s take a look at the average WARP10 returned per pick: Average WARP10 Returned by Program, Per Pick
After looking at this data from multiple angles, it’s clear that WARP10 returned per pick is the most accurate way (of the methods reviewed) to measure each program’s value returned. ARP10/pick and AA10/pick are adequate for simply determining which programs have produced useful major-league pieces, but without considering the total WARP10 produced, the impact of those players is lost. Next week we’ll get granular and examine which players in the study represented the greatest and worst values relative to their draft position.
|
Interesting breakdown. I see colleges like St. John's, Kentucky, BYU(!) etc and I wonder if you will include a breakdown by warm weather/cold weather colleges?
It's a thought, certainly something I'd be interested in seeing.