<< Previous Article
Baseball ProGUESTus: M... (10/07)
|
<< Previous Column
BP Unfiltered: Where Y... (09/29)
|
Next Column >>
BP Unfiltered: Interne... (10/10)
|
Next Article >>
 Playoff Prospectus: A ... (10/08) Playoff Prospectus: A ... (10/08)
|
October 8, 2011
BP Unfiltered
NLCS Umpire Charts and Data
by Mike Fast
I worked up some umpire data for Mike Ferrin and the MLB Network Radio show for the National League Championship Series between the Milwaukee Brewers and the St. Louis Cardinals, and I thought some of you might be interested in seeing the data.
One of the umpires on the NLCS crew is Bill Miller, who has had the biggest strike zone among regular MLB umpires in the 2010 and 2011 seasons. Miller has called more strikes outside the average strike zone called by MLB umpires ("extra strikes") and fewer balls inside the average strike zone ("extra balls") than any other umpire. Here is where the other NLCS umpires rank by that measure, as compared to their peers.
.jpg)
Here is the data for all the regular umpires 2010 to 2011, ordered from biggest strike zone to smallest.
|
Umpire
|
Pitches
|
Correct%
|
Extra Ball%
|
Extra Strike%
|
Delta
|
|
Bill Miller
|
9705
|
90.2%
|
4.7%
|
5.1%
|
-0.4%
|
|
Doug Eddings
|
9892
|
89.6%
|
5.5%
|
4.9%
|
0.6%
|
|
Vic Carapazza
|
5512
|
90.9%
|
4.9%
|
4.3%
|
0.6%
|
|
Bob Davidson
|
10525
|
89.2%
|
5.8%
|
5.0%
|
0.8%
|
|
Wally Bell
|
9328
|
89.8%
|
5.5%
|
4.7%
|
0.8%
|
|
Brian Runge
|
7647
|
90.1%
|
5.5%
|
4.4%
|
1.0%
|
|
Ted Barrett
|
9551
|
89.5%
|
5.8%
|
4.7%
|
1.1%
|
|
Jeff Nelson
|
10128
|
90.6%
|
5.4%
|
4.0%
|
1.4%
|
|
Tim Welke
|
10020
|
89.8%
|
5.8%
|
4.4%
|
1.5%
|
|
John Hirschbeck
|
8301
|
89.2%
|
6.2%
|
4.7%
|
1.5%
|
|
Gary Darling
|
9885
|
90.2%
|
5.7%
|
4.1%
|
1.7%
|
|
Paul Emmel
|
8052
|
89.7%
|
6.0%
|
4.2%
|
1.8%
|
|
Mike Estabrook
|
8430
|
89.7%
|
6.1%
|
4.3%
|
1.8%
|
|
Brian Gorman
|
9645
|
90.0%
|
5.9%
|
4.1%
|
1.8%
|
|
Rob Drake
|
9590
|
89.0%
|
6.5%
|
4.5%
|
1.9%
|
|
Dan Iassogna
|
9389
|
90.1%
|
6.0%
|
4.0%
|
2.0%
|
|
Ron Kulpa
|
10129
|
89.5%
|
6.3%
|
4.2%
|
2.0%
|
|
Phil Cuzzi
|
10044
|
89.7%
|
6.2%
|
4.1%
|
2.1%
|
|
Fieldin Culbreth
|
9756
|
91.1%
|
5.5%
|
3.4%
|
2.2%
|
|
Brian O'Nora
|
9364
|
90.1%
|
6.1%
|
3.8%
|
2.3%
|
|
Tim Timmons
|
9337
|
89.6%
|
6.3%
|
4.1%
|
2.3%
|
|
Jim Reynolds
|
8589
|
90.0%
|
6.2%
|
3.9%
|
2.3%
|
|
Jeff Kellogg
|
9574
|
89.2%
|
6.6%
|
4.2%
|
2.3%
|
|
Mike Everitt
|
10176
|
89.9%
|
6.2%
|
3.9%
|
2.3%
|
|
Marvin Hudson
|
9472
|
89.8%
|
6.3%
|
3.9%
|
2.4%
|
|
Dan Bellino
|
8339
|
89.8%
|
6.3%
|
3.9%
|
2.4%
|
|
Laz Diaz
|
9695
|
90.2%
|
6.1%
|
3.7%
|
2.4%
|
|
Larry Vanover
|
8904
|
88.9%
|
6.7%
|
4.3%
|
2.4%
|
|
Eric Cooper
|
9472
|
88.9%
|
6.8%
|
4.3%
|
2.5%
|
|
Andy Fletcher
|
9323
|
89.3%
|
6.6%
|
4.0%
|
2.6%
|
|
Jerry Meals
|
9672
|
90.5%
|
6.1%
|
3.4%
|
2.7%
|
|
Hunter Wendelstedt
|
9589
|
89.8%
|
6.5%
|
3.7%
|
2.7%
|
|
Marty Foster
|
8299
|
90.6%
|
6.1%
|
3.3%
|
2.8%
|
|
Jim Wolf
|
9335
|
90.6%
|
6.1%
|
3.3%
|
2.8%
|
|
Mark Carlson
|
9549
|
88.9%
|
7.0%
|
4.1%
|
2.8%
|
|
Mike Winters
|
10346
|
88.9%
|
7.0%
|
4.1%
|
2.9%
|
|
D.J. Reyburn
|
7041
|
90.9%
|
6.0%
|
3.1%
|
2.9%
|
|
Bill Welke
|
8978
|
90.4%
|
6.2%
|
3.3%
|
2.9%
|
|
Dana DeMuth
|
10173
|
90.4%
|
6.3%
|
3.4%
|
2.9%
|
|
Gary Cederstrom
|
9850
|
89.7%
|
6.7%
|
3.7%
|
3.0%
|
|
Dale Scott
|
10263
|
88.7%
|
7.2%
|
4.1%
|
3.0%
|
|
Mike Muchlinski
|
6110
|
89.8%
|
6.6%
|
3.6%
|
3.1%
|
|
Angel Hernandez
|
9967
|
89.5%
|
6.8%
|
3.7%
|
3.1%
|
|
Lance Barksdale
|
8099
|
89.2%
|
7.0%
|
3.9%
|
3.1%
|
|
CB Bucknor
|
10081
|
89.0%
|
7.1%
|
3.9%
|
3.2%
|
|
Mike DiMuro
|
9625
|
89.8%
|
6.7%
|
3.4%
|
3.3%
|
|
Brian Knight
|
8862
|
90.0%
|
6.6%
|
3.4%
|
3.3%
|
|
James Hoye
|
9438
|
89.8%
|
6.8%
|
3.5%
|
3.3%
|
|
Ed Rapuano
|
10256
|
89.7%
|
6.8%
|
3.5%
|
3.3%
|
|
Tony Randazzo
|
9799
|
90.2%
|
6.6%
|
3.2%
|
3.4%
|
|
Chris Guccione
|
9802
|
90.7%
|
6.3%
|
3.0%
|
3.4%
|
|
Bruce Dreckman
|
9286
|
89.9%
|
6.7%
|
3.3%
|
3.4%
|
|
Paul Nauert
|
7980
|
89.6%
|
6.9%
|
3.5%
|
3.4%
|
|
Joe West
|
10646
|
89.9%
|
6.7%
|
3.3%
|
3.4%
|
|
Kerwin Danley
|
10065
|
89.9%
|
6.8%
|
3.3%
|
3.5%
|
|
Jerry Layne
|
9269
|
89.4%
|
7.2%
|
3.4%
|
3.8%
|
|
Jim Joyce
|
6140
|
89.3%
|
7.3%
|
3.4%
|
3.9%
|
|
Adrian Johnson
|
9949
|
88.9%
|
7.5%
|
3.6%
|
4.0%
|
|
Alan Porter
|
5407
|
90.0%
|
7.0%
|
3.0%
|
4.0%
|
|
Todd Tichenor
|
9729
|
89.4%
|
7.4%
|
3.2%
|
4.2%
|
|
Alfonso Marquez
|
10059
|
89.5%
|
7.3%
|
3.2%
|
4.2%
|
|
Tom Hallion
|
9295
|
90.2%
|
7.0%
|
2.8%
|
4.2%
|
|
Ed Hickox
|
9528
|
89.4%
|
7.5%
|
3.1%
|
4.4%
|
|
Angel Campos
|
6852
|
89.0%
|
7.7%
|
3.3%
|
4.4%
|
|
Derryl Cousins
|
9698
|
89.5%
|
7.5%
|
3.1%
|
4.4%
|
|
Sam Holbrook
|
8900
|
89.0%
|
7.7%
|
3.3%
|
4.4%
|
|
Mark Wegner
|
6283
|
90.0%
|
7.3%
|
2.7%
|
4.6%
|
|
Scott Barry
|
9193
|
89.0%
|
7.8%
|
3.2%
|
4.6%
|
|
Greg Gibson
|
9793
|
89.3%
|
7.6%
|
3.0%
|
4.6%
|
|
Chad Fairchild
|
9368
|
88.3%
|
8.2%
|
3.5%
|
4.8%
|
|
Mike Reilly
|
5160
|
88.4%
|
8.3%
|
3.3%
|
5.0%
|
|
Tim Tschida
|
8016
|
88.4%
|
8.4%
|
3.2%
|
5.2%
|
|
Tim McClelland
|
9623
|
89.5%
|
7.9%
|
2.6%
|
5.3%
|
|
Gerry Davis
|
9344
|
89.1%
|
8.3%
|
2.6%
|
5.7%
|
|
Paul Schrieber
|
5880
|
89.2%
|
8.3%
|
2.5%
|
5.7%
|
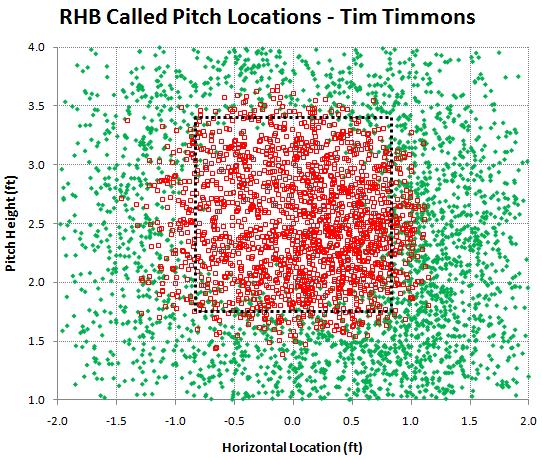
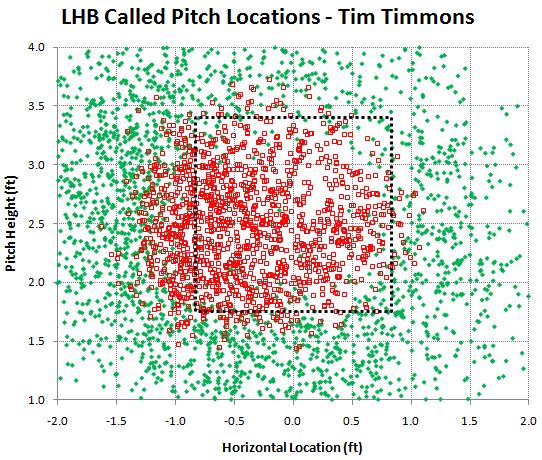
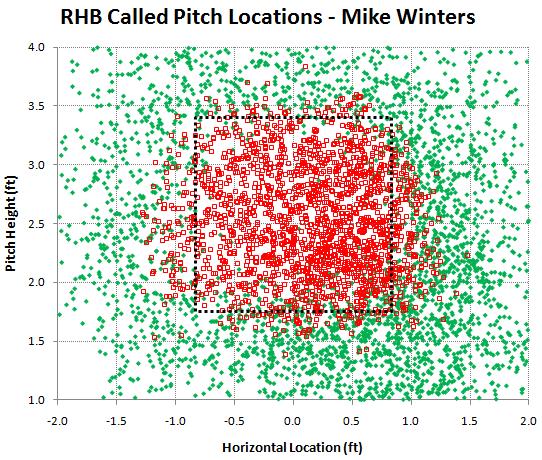
We can also look at how the umpires' strike zones shifted horizontally with left-handed and right-handed batters at the plate. Here is how the NLCS umpires compare to their peers in how many strike calls they made off the plate outside past the average umpire's strike zone on pitches between 2.1 and 3.1 feet high.
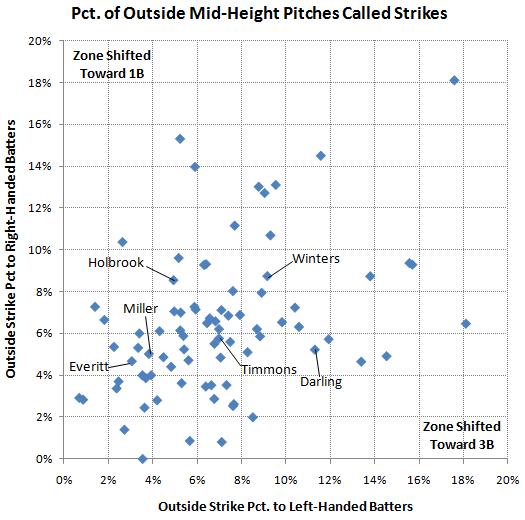
Here is the data for all the regular umpires from the 2010 and 2011 seasons.
|
Umpire
|
LHB Outside Strike%
|
RHB Outside Strike%
|
|
Tim McClelland
|
1%
|
3%
|
|
Eric Cooper
|
1%
|
3%
|
|
Phil Cuzzi
|
2%
|
7%
|
|
Chad Fairchild
|
2%
|
4%
|
|
Larry Vanover
|
3%
|
10%
|
|
Angel Campos
|
3%
|
1%
|
|
Mike Everitt
|
3%
|
5%
|
|
Mike Muchlinski
|
3%
|
5%
|
|
Alfonso Marquez
|
3%
|
6%
|
|
Alan Porter
|
4%
|
4%
|
|
Paul Schrieber
|
4%
|
0%
|
|
Lance Barksdale
|
4%
|
2%
|
|
Angel Hernandez
|
4%
|
4%
|
|
Bill Miller
|
4%
|
5%
|
|
Gerry Davis
|
4%
|
4%
|
|
Mark Wegner
|
4%
|
3%
|
|
Gary Cederstrom
|
4%
|
6%
|
|
Paul Nauert
|
4%
|
5%
|
|
Jim Wolf
|
5%
|
4%
|
|
Sam Holbrook
|
5%
|
9%
|
|
Brian Knight
|
5%
|
7%
|
|
Dale Scott
|
5%
|
10%
|
|
CB Bucknor
|
5%
|
15%
|
|
Jeff Nelson
|
5%
|
6%
|
|
Vic Carapazza
|
5%
|
7%
|
|
Paul Emmel
|
5%
|
6%
|
|
James Hoye
|
5%
|
5%
|
|
D.J. Reyburn
|
6%
|
5%
|
|
Tim Tschida
|
6%
|
1%
|
|
Bruce Dreckman
|
6%
|
7%
|
|
Rob Drake
|
6%
|
14%
|
|
Scott Barry
|
6%
|
7%
|
|
Jerry Meals
|
6%
|
9%
|
|
Todd Tichenor
|
6%
|
3%
|
|
Dan Iassogna
|
6%
|
9%
|
|
Jim Joyce
|
7%
|
7%
|
|
Derryl Cousins
|
7%
|
4%
|
|
Jeff Kellogg
|
7%
|
3%
|
|
Mike DiMuro
|
7%
|
6%
|
|
Marvin Hudson
|
7%
|
7%
|
|
Marty Foster
|
7%
|
6%
|
|
Tim Timmons
|
7%
|
6%
|
|
Bill Welke
|
7%
|
5%
|
|
Ron Kulpa
|
7%
|
7%
|
|
Tony Randazzo
|
7%
|
1%
|
|
Mark Carlson
|
7%
|
4%
|
|
Dana DeMuth
|
7%
|
6%
|
|
Mike Estabrook
|
8%
|
8%
|
|
Greg Gibson
|
8%
|
3%
|
|
Ed Hickox
|
8%
|
3%
|
|
Dan Bellino
|
8%
|
11%
|
|
Jim Reynolds
|
8%
|
7%
|
|
Joe West
|
8%
|
5%
|
|
Adrian Johnson
|
9%
|
2%
|
|
Brian O'Nora
|
9%
|
13%
|
|
Doug Eddings
|
9%
|
6%
|
|
Chris Guccione
|
9%
|
8%
|
|
Jerry Layne
|
9%
|
13%
|
|
Mike Winters
|
9%
|
9%
|
|
Brian Runge
|
9%
|
11%
|
|
Andy Fletcher
|
10%
|
13%
|
|
Tom Hallion
|
10%
|
7%
|
|
Laz Diaz
|
10%
|
7%
|
|
Ed Rapuano
|
11%
|
6%
|
|
Gary Darling
|
11%
|
5%
|
|
Ted Barrett
|
12%
|
14%
|
|
Fieldin Culbreth
|
12%
|
6%
|
|
Brian Gorman
|
13%
|
5%
|
|
Hunter Wendelstedt
|
14%
|
9%
|
|
Kerwin Danley
|
15%
|
5%
|
|
Tim Welke
|
16%
|
9%
|
|
Bob Davidson
|
16%
|
9%
|
|
John Hirschbeck
|
18%
|
18%
|
|
Wally Bell
|
18%
|
6%
|
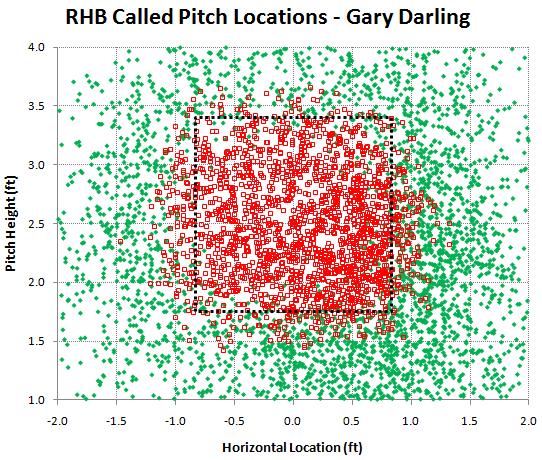
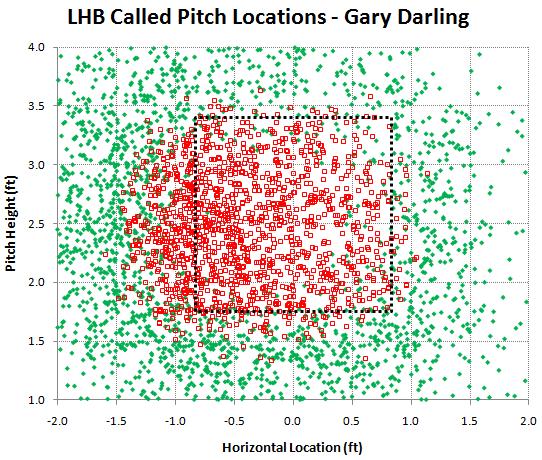
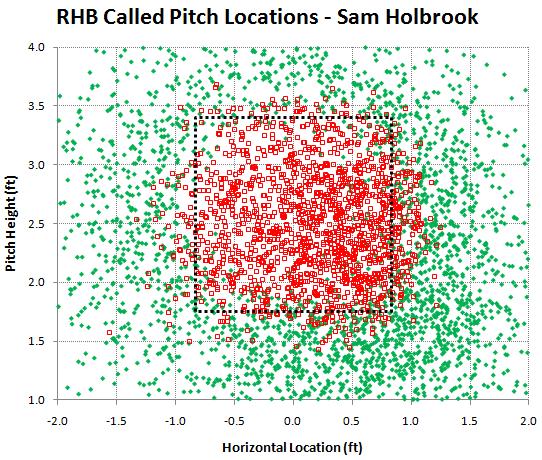
Finally, here are strike zone charts showing all the ball and strike calls made by the six umpires on the NLCS crew during the 2010 and 2011 seasons. These charts are from the umpire and catcher perspective.


Reference articles:
The Real Strike Zone
The Real Strike Zone, Part 2
Mike Fast is an author of Baseball Prospectus.
Click here to see Mike's other articles.
You can contact Mike by clicking here
<< Previous Article
Baseball ProGUESTus: M... (10/07)
|
<< Previous Column
BP Unfiltered: Where Y... (09/29)
|
Next Column >>
BP Unfiltered: Interne... (10/10)
|
Next Article >>
Playoff Prospectus: A ... (10/08)
|
 7 comments have been left for this article.

Wow, this is awesome!