


 21 comments have been left for this article.
 BP Comment Quick Links

|

|
September 30, 2011 Baseball ProGUESTusA New Take on Plate Discipline--Redefining the ZoneBelieve it or not, most of our writers didn't enter the world sporting an @baseballprospectus.com address; with a few exceptions, they started out somewhere else. In an effort to up your reading pleasure while tipping our caps to some of the most illuminating work being done elsewhere on the internet, we'll be yielding the stage once a week to the best and brightest baseball writers, researchers and thinkers from outside of the BP umbrella. If you'd like to nominate a guest contributor (including yourself), please drop us a line. Matt Lentzner has carved out a (very) small niche in the baseball analysis world by examining the intersection of physics and biomechanics. He has presented at the PITCHf/x conference in each of the last two years and has written articles for The Hardball Times, as well as a previous article for Baseball Prospectus. When he’s not writing, Matt works on his physics-based baseball simulator, which is so awesome and all-encompassing that it will likely never actually be finished, though it does provide the inspiration for most of his articles and presentations. In real life, he’s an IT Director at a small financial consulting company in the Silicon Valley and also runs a physical training gym in his backyard on the weekends.
Challenge the strike zone with all types of pitches all the time.—Dr. Mike Marshall, Pitching Coach The single most important thing for a hitter is to get a good pitch to hit.—Rogers Hornsby (as told by Ted Williams) It ain't nuthin' until I call it.—Bill Klem, HOF Umpire I realize it’s a little excessive to start an article off with three quotes, but I have my reasons for engaging in such behavior. What I am trying to illustrate is that there are three actors involved in any pitch: the pitcher himself, the batter, and lest we forget, the umpire—the arbiter of strikes and balls. Of specific interest is the quote from Dr. Marshall. Notice that he doesn’t say to throw strikes; he says to challenge the strike zone. That is, the pitched ball should be close enough that the batter cannot immediately dismiss the pitch as a ball. On the other hand, Rogers Hornsby makes the case that the batter should be waiting for the pitcher to make a mistake or be forced to throw a hittable pitch. The pitcher is trying to avoid this but at the same time throw pitches that are close, but not too close to the heart of the plate. Klem reminds us that there is a human involved in calling these pitches who can’t be dismissed either. Plate discipline measurements have up until now only considered the binary condition of the pitch—either it was in the rulebook strike zone or it was not. While that is the simplest and most obvious way to classify pitches, it ignores the reality of how baseball is played.
The main factor that makes the binary approach too simple is the umpire’s limited perception. There is a zone near the center of the plate that is almost always called a strike. There is a zone far from the plate where pitches are almost always called balls. But there is also a zone where pitches are sometimes called balls and sometimes called strikes. The delineation is not as sharp as the binary model assumes. We have a gradient.
This graphic is based on a study originally done by the Greta Garbo of Sabermetrics, John Walsh. The original study is here. It’s an oldie but a goodie. If you haven’t seen it already, I encourage you to do so. (And John, if you read this, just know that we all miss you). In the study, John looked at the middle section of the strike zone and determined the chances of the pitch being called a ball or strike. Notice the trapezoidal shape of the graphs. We have a relatively flat zone that corresponds to the interior of the strike zone where nearly all pitches are guaranteed to be called strikes. The line slopes down to an effectively zero chance of a called strike. However, in between those two areas is a gray area. How often do pitchers throw a pitch in the gray area? More often than you’d think—about 50 percent of the time. So, Instead of strikes and balls, we have three conditions—a ternary model:
This amazing graphic courtesy of David Allen, called a heat map, shows the per pitch value of pitches thrown to different locations. Red is best for the pitcher and blue is best for the batter. Dr. Marshall was right. You can see how pitches too far from the strike zone are a boon for the batter. A pitcher must challenge the strike zone. Notice the donut shape of the pitcher’s best zone. Close, but not too close is the best result. Notice how the red zones creep past the nominal strike zone. Note that the strike zone pictured is based on how umpires actually call games. The rulebook zone is considerably narrower and taller. Here’s a better picture of what’s really going on regarding a batter’s approach to hitting.
I owe a huge thanks to David Allen, who not only shared his excellent graphics with me but also determined the exact dimensions of the ternary zones. Note that the horizontal strike zone is not the same for right-handed and left-handed batters. This is an effect of umpiring. “ Sz_bot” and “sz_top” refer to the vertical strike zone boundaries set by the PITCHf/x operator based on the height and stance of the batter.
If this is making your eyes glaze over, here are the CliffsNotes: How do the pitch types break down? Let’s take a look.
This actually surprised me. Pitchers work the Borderline about 50 percent of the time, and only 20 percent of the pitches they throw would be considered “mistake” or “get-me-over” pitches. The fact that almost one in three pitches are True Balls is also surprising to me. The fingerprints of being a pitcher as opposed to simply a thrower are all over this pie chart. As we will see, most batters, especially power hitters, tend to murder True Strikes. Not surprisingly, batters across the board do poorly against True Balls when they swing at them—which is not very often. Borderline pitches are a pitcher’s best friend. In many counts, the batter is compelled to swing at them with predictably mediocre results. The alternative is risking a strikeout, so it’s a sort of a damned-if-you-do, damned-if-you-don’t situation. Of course, the pitcher is loving it. Here’s the average performance of batters against the differing pitch types.
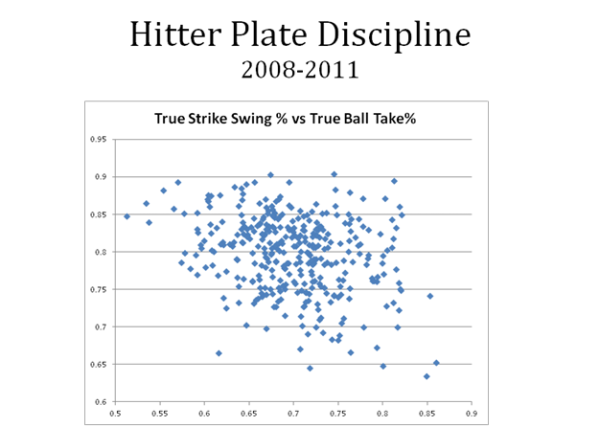
“Swing %” is simply the percentage of time that batters swing at this pitch type. “Contact %” is the chance that the batter will make some kind of contact with the pitch—not necessarily put it in play. “BAcon” is the batting average on the pitches contacted and put in play. “SLGcon” is the “slugging percentage” of pitches contacted and put in play. BAcon and SLGcon are probably unfamiliar measurements. Both will look very high because we are removing the strikeouts from the equation. BAcon is even higher than BABIP (Batting average on balls in play), since BAcon includes home runs while BABIP does not. The “Overall” column is there so you can get your bearings on what is an average value for those measures. I hope by now you agree that the binary (strikes and balls) model doesn’t work that well. Within the strike zone we have good and bad pitches. Outside of the strike zone we have good and bad pitches. Setting up your buckets that way significantly muddies the water and dilutes and conclusions you can make. By breaking the pitches up into three groups, you can characterize them much better and get better answers. Let’s move on. There is a ton of analysis possible with this approach—several articles’ worth, at least. Let’s look at a little of that just to get an idea of ways to look at hitters and how they differ. Here’s a scatter plot of swing% against True Strikes (x-axis) vs. take% (opposite of swing%) against True Balls (y-axis) for all batters with a minimum of 1500 PAs over 2008, 2009, 2010, and the first half of 2011.
The first thing you can see here is that the swing% of true strikes versus the take% of true balls is not very closely correlated. You can sort of see a weak linear effect going from the high left quadrant to the low right quadrant—maybe. One thing to keep in mind is that batters who reside on the low left quadrant have the worst plate discipline. They swing at the most True Balls and watch the most True Strikes go by, dardly a recipe for success. I would expect a strong selection bias that would remove most of these players from the major-league hitting pool. I doodled a little on that same scatter plot to show this.
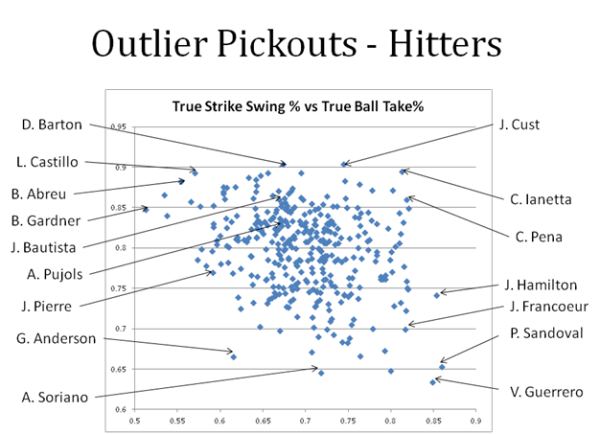
The upper left quadrant contains the players who just take a lot of pitches. They are biased toward not swinging at True Balls, so they miss quite a few True Strikes in the process. The lower right quadrant batters are those guys who like to swing the bat. They are biased toward not missing out on hitting the snot out of a True Strike, so they end up chasing more True Balls. The upper right quadrant hitters are the elite. They aggressively attack True Strikes yet are not often fooled by True Balls. Let’s take a look at some of the outliers to get an idea of who these guys are.
The identities of a lot of these players are no surprise. Vladimir Guerrero is one of the most aggressive hitters in baseball? Stop the presses! But I was surprised by Chris Iannetta. I’m more of a American League guy myself, so I didn’t know much about him, but if we’re talking elite plate discipline, then he’s the guy. Brett Gardner has a freakish ability to take pitches. Garrett Anderson leads in the hopelessly confused category. Regarding Garrett, it’s too bad we don’t have PITCHf/x data going back far enough to see what he did in his prime. It is certainly possible that his loss of plate discipline led to his decline as a hitter. It’s also possible that he was a unique player who could be good with substandard plate discipline. It would be interesting to track hitters to see if a loss of plate discipline predicts a future decline in hitting ability. Likewise, positive changes could be signs of improving skill and future productivity. My last comment would be that plate discipline is not everything. I included Jose Bautista and Albert Pujols to give some perspective on that. Both have good plate discipline, but not elite. Iannetta is a good hitter (especially for a catcher), but he is not an elite hitter. We have good and bad hitters who are aggressive and good and bad hitters who are passive. I would say that you can be successful by attacking True Strikes or passing on True Balls, but you won’t be successful doing neither. Let’s see how that graph looks with pitchers.
I kept the scale the same as the batters graph so you could see right away that there is less variability among pitchers than hitters. There also seems to be even less correlation between the two factors. Also keep in mind that the best pitchers are in the lower left quadrant now. What’s good for a batter is bad for a pitcher, and vice versa. Here’s what that looks like with my notes added.
So, whom are we looking at?
What’s interesting about this graph is although the variability is lower, the relationship to pitcher quality is much higher. The elite “anti-discipline” pitchers are also among the elite pitchers overall. The pitchers on the other end of the spectrum are universally terrible. Carlos Marmol is an interesting and extreme case. We should call him “The Paralyzer.” Nobody induces looking strikes like he does—it’s not even close. It must be some combination of ridiculous movement and terrible control; batters are just hoping they get walked or end up in a fastball count. Another way I looked at the data is by profiling. You tend to see similar types of hitters and pitchers appearing. For example, with hitters we have the contact-hitting type compared with the power hitters.
I find this fascinating. For these two contact hitters, their results on balls in play are largely unchanged regardless of where the ball was pitched. Note that this doesn’t mean that it doesn’t matter at all where the ball was pitched. Castillo, for example, has much higher contact rates versus true strikes as opposed to true balls, even though the results of hit balls are not much different. These two power hitters are exactly the opposite. They destroy true strikes and the drop-off as pitch quality degrades is pretty severe. Carlos Pena does not hit True Balls much better than the slap hitters do. Much worse, actually, since he is a lot more likely to miss it completely. So we have two interesting profiles here. Contact hitters get their value from putting the ball in play and not striking out. Power hitters get most of their value from hitting the crap out of “mistake” pitches. I don’t pretend that this is earthshaking news to anyone, but now we can see it in the numbers. It’s been quantified. Here are some pitcher comparisons that are interesting.
This somewhat parallels the hitter profiles in almost an opposite way. The control pitchers have to be careful where they pitch the ball. True Strikes will get hammered. They get their value by not throwing True Strike mistake pitches and getting batters to chase True Balls. The dominance pitchers have a much more “you can’t touch this” approach. Even on True Strikes, batters don’t do particularly well. They can attack the strike zone aggressively. The control artists need more guile and finesse. Also not a shocking discovery, but there it is, measured and quantified. With that, I will wrap this article up. But as I mentioned earlier, we have just scratched the surface. How does this approach pan out by counts? How does it change over a career? Can we use this analysis to predict future success with prospects based on minor-league numbers or rookie year performances? I’m sure you can think of a few more avenues of exploration I didn’t mention. Fear not. I intend to explore this area more fully in future articles, and I hope I’ve inspired others to do the same.
|
Fascinating article. Great stuff, Matt!