


 71 comments have been left for this article.
 BP Comment Quick Links

|

|
September 24, 2011 Spinning YarnRemoving the Mask Encore Presentation
I Was Framed Dan Turkenkopf was one of the first analysts to investigate this phenomenon using detailed pitch location data. He found that catchers differed significantly in their performance at getting strike calls from umpires. Matthew Carruth and Bill Letson followed up with additional research and similar conclusions. The size of the effect that Dan and Bill found was so large as to be almost unbelievable. Earlier this year, I observed that where the catcher set the target relative to the edge of the strike zone and whether the pitcher hit the target had a large impact on the likelihood of a strike call. Some pitchers, such as Tom Glavine and Livan Hernandez, were consistently able to expand the edges of the strike zone by several inches. The fact that catchers are paired with a limited number of pitchers in a season affects our ability to properly assign credit for extra strike calls to catchers. Adjusting for pitcher-catcher pairing reduces the apparent size of the catcher responsibility for the effect to more reasonable levels. When I reported this observation, I applied a pitcher adjustment to Bill Letson’s catcher receiving numbers from 2008-2009. Now, having added catcher defensive information to my own pitch database, I am in position to report my own measurements of catcher performance at getting extra strikes for their pitchers.
Catcher Performance Results Next, I applied the same procedure for each pitcher-catcher pair and subtracted the pitcher baseline from the result. Then, I summed the results by catcher. I also calculated an approximate run value for the extra strikes saved or lost by each catcher using Dan Turkenkopf’s finding that switching the call from a ball to a strike on a close pitch was worth about 0.13 runs on average. Here is how catchers have done over the past five seasons, according to this method, at saving runs for their team by getting extra strike calls at the edge of the zone.
Data for all catchers are available here. These numbers are for the observed performance, and they do not incorporate any regression toward the league average in order to estimate the persistent skill level going forward. We do not distinguish here how catchers may be getting the extra strike calls for their pitchers. It may be that they have superior mechanics that influence the umpire to call more strikes, whether by action or lack of action on the catcher’s part. Or, it may be that they are particularly adept at setting the target for the pitcher in such way that he delivers the ball on a trajectory that is more likely to get a strike call. It may even be that some catchers exert a verbal influence over umpires or develop friendships that sway calls in their favor. Any effect that gains strike calls and is related to the catcher should be captured here.
Do These Numbers Make Sense?
The run impact of the walk and strikeout changes for the pitchers is about one third of the total run impact we would expect based upon the changes in ball-strike calls. Since walks and strikeouts comprise about a third of the total run impact at the team pitching level, we can presume that the remainder of the run impact from extra strike calls would be observed if we calculated the run impact of changes in results of balls in play. However, it would be worthwhile to verify that presumption. In The Hardball Times Baseball Annual 2011, Sean Smith introduced a new method for computing catcher ERA. He looked at multi-year samples of pitcher-catcher pairs from 2003-2009 and computed estimated runs based upon defense independent pitching statistics and batted ball classifications. He found that catcher skill varied by about +/- 15 runs per season between the best and worst catchers, after applying significant regression toward the mean. (He added about three seasons of league-average performance to each catcher’s numbers.) The unregressed observed performance varied by about +/- 40 runs per season. Sean’s numbers include the catcher’s performance at getting extra strike calls, along with pitch calling and any coaching or interaction between catcher and pitcher that affected the pitcher’s performance against the batter. Catchers that are particularly good at pitch calling or coaching their pitchers might rate better in Sean’s method than in my method here, which is restricted to measuring the effect of extra strikes. Sean reported results for 20 catchers who also played at least one full season in my sample. His regressed results for those catchers correlate well with my results here, at r=0.59. Some of the differences may plausibly be attributed to pitch calling and coaching skills. For example, Jason Kendall rates poorly in my metric and above average in Sean’s, and Ivan Rodriguez rates about average in my metric and fairly high in Sean’s. The catchers who are best and worst in getting extra strike calls repeat pretty well from one season to another. We can group the 2008 and 2010 seasons in one pool and the 2009 and 2011 seasons in the other pool and compare the extra strike rates between pools for all 39 catchers who caught at least 6000 called pitches in each pool.
We may not be measuring the extra strike effect perfectly, but it does seem to stand up to basic scrutiny. The correlation for catcher ratings between the two pools is around r=0.7, depending on where exactly the playing time cutoff is set. That means that we should add about half a season’s worth, or 4500 called pitches, of league-average performance to the observed performance for each catcher in order to get a better estimate of the catcher’s actual skill level. If these numbers accurately represent catcher performance at getting extra strike calls, catchers have the ability to gain or cost their team a win or two over the course of the season in this department. That would make this skill as important as all the other facets of catcher defense that we are currently able to measure (preventing stolen bases, blocking pitches, and fielding balls) put together. My method controls for the effect of pitcher bias in each catcher’s sample. Max Marchi used a mixed-level regression model to control for the effect of bias from pitchers, umpires, batters, ball-strike count, pitch location, and pitch type. His results show a similar magnitude for the variation in framing performance among catchers and have a good correlation with my results for individual catchers. (Correlation coefficient was r=0.86 between Max’s results and mine for the 80 catcher-seasons for which Max reported results.)
Problems with Catcher Comparisons For example, Joe Mauer has been the starting catcher for the Minnesota Twins during all five seasons 2007-2011, and the Twins have primarily developed their pitching staff from within. As a result, Mauer himself has caught 50 percent of the pitches by the pitchers who made up his comparison baseline. The Twins backup catchers during that period make up another 30 percent of the pitcher baseline, led by 11 percent from Drew Butera and nine percent from Mike Redmond. The rest of the catchers in the league make up only 20 percent of the pitcher baseline for Mauer. As a result, this method probably understates Mauer’s performance, and in addition, the performance of Butera and Redmond may have unduly affected his rating. Similarly, Mauer’s performance may unduly affect Butera and Redmond’s ratings. Jeff Mathis and Mike Napoli were a long-time pairing at catcher for the Angels. Mathis himself caught 36 percent of the pitches by the pitchers who made up his comparison baseline. Napoli caught 24 percent of the pitches in the pitcher baseline for Mathis, and other Angel backup catchers caught another 14 percent. The rest of the catchers in the league made up 25 percent of the pitcher baseline for Mathis. However, as can be seen in the previous table of extra strike results, neither Mathis nor Napoli saw a large change in their performance after Napoli changed teams during the 2010-2011 offseason. On the other hand, John Buck changed teams twice during the sample period, going from Kansas City in 2007-2009 to Toronto in 2010 and to Florida in 2011. Buck caught 28 percent of the pitches in his own pitcher baseline. The other top ten leading catchers represented in Buck’s pitcher baseline were Olivo (10 percent), Kendall (five percent), Paulino (five percent), John Baker (five percent), Barajas (four percent), J.P. Arencibia (four percent), Brayan Pena (three percent), Jose Molina (three percent), Zaun (two percent), and Treanor (two percent). These catchers represent a good mix of varying performance in getting extra strike calls, and as such probably make for a fairly accurate comparison. Buck’s performance dropped significantly from 2009 to 2010; however, the changes in comparison baseline do not seem to explain the drop. I am unsure whether the change represents a real change in performance for Buck or a measurement artifact of unknown nature. Between Mauer at one extreme and Buck at the other, catchers are compared to varying sets of other catchers in the league. Max Marchi’s mixed-level modeling is designed to address this concern at least to some extent. Max noted with his method that 14 catchers who switched teams had an extra-strike rate in the new season that correlated at r=0.67 with their previous season’s performance, whereas 53 catchers who stayed on the same team had a season-to-season correlation of r=0.82. I observed a correlation at r=0.61 using my method for the same 14 team-switching catchers.
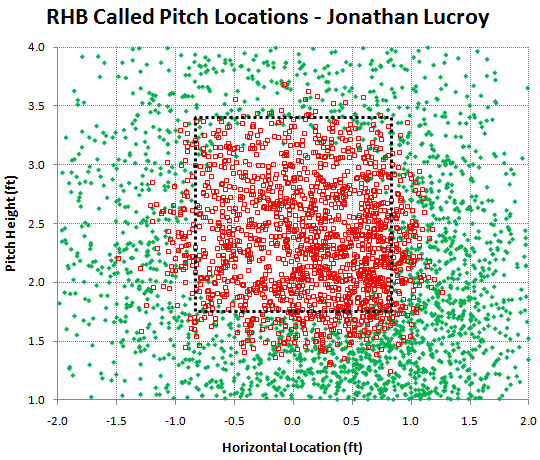
Catcher Receiving Techniques I selected two of the best catchers—Jose Molina and Jonathan Lucroy—and three of the worst catchers—Ryan Doumit, Jorge Posada, and Jason Varitek—and reviewed video of their borderline pitch calls. I observed two primary differences in technique between the good and bad catchers. Both Molina and Lucroy displayed stable, quiet mechanics when receiving borderline pitches. Posada was the opposite, often jumping, bouncing, and shifting his stance and lunging and swiping to catch pitches. It was almost painful to watch him behind the plate. Varitek and Doumit had more stable stances, but each displayed a negative behavior that appeared to cost them strike calls. (Posada displayed both of these negative traits, and more.) It is worth mentioning that one should not compare receiving mechanics on curveballs to mechanics on other pitch types, as was done in this analysis of Lucroy. Catchers typically set up with a different stance on curveballs to prepare to block a possible pitch in the dirt. Curveballs also drop much faster from the front of the plate to the catcher’s glove than other pitch types do. (The numbers reported above include all pitch types, but one potential improvement would be to look at receiving numbers for curveballs separately, though the smaller sample size could be a challenge.) Let’s compare Varitek to Lucroy. According to my metric, Varitek cost the Red Sox about 16 runs by losing 101 expected strike calls in part time duty over the last two seasons. Lucroy took over the starting job for the Brewers in the middle of the 2010 season and has gained about 41 runs by getting 284 extra strike calls since then. Lucroy got extra strikes for his pitchers both on the bottom and outside edges of the strike zone. Varitek did not get these same calls for his pitchers. Let’s see how they compared in 2011 on calls to right-handed batters.
I reviewed video of seven pitches caught by Lucroy along the bottom boundary of the zone and six pitches caught by Varitek along the bottom of the zone. Lucroy and Varitek both had stable, quiet stances, but Lucroy’s glove was also very quiet in receiving all seven pitches, whereas Varitek stabbed at the ball with a much bigger arm motion for all six pitches. Compare Lucroy and Varitek’s glove movements in the following pitch animations. Both pitches are fastballs that crossed the front of home plate about 22 inches above the ground.
Lucroy’s glove moved a few inches at most, but Varitek’s glove traveled about two feet down and then back up. I also reviewed video of 10 pitches caught by Jose Molina along the outside edge of the zone to left-handed batters and 12 pitches caught by Doumit in similar locations. Eight of ten pitches received by Molina were called strikes, and 10 of 12 pitches received by Doumit were called balls. Let’s see how they compared in 2011 on calls to left-handed batters:
Molina got quite a few more strike calls on the outside edge with left-handed batters at the plate than Doumit did. Compare Molina and Doumit’s movements in the following pitch animations. Despite Doumit’s solid stance and subtle glove movement, he dropped his head to follow the pitch into his glove and he hunched down slightly, as if he were trying to coax the ball carefully into his glove. Molina’s head stayed mostly stable as he received the pitch.
Doumit dropped his head on 11 of the 12 pitches I reviewed on video. On the one pitch where he did not do that, he got a strike call. Molina dropped his head to follow the ball into the glove on two of the 10 pitches I reviewed on video, and both of those pitches were called balls. Lucroy’s head was stable on all seven pitches I reviewed, and he got seven strike calls. Varitek’s head was stable on all six pitches I reviewed, all called balls, but his exaggerated glove movement may have cost him those strike calls. I also reviewed five of Posada’s borderline pitches on video. In two cases, his arm and body movements were very exaggerated and potentially distracting to the umpires. In the other three cases, his body and glove were fairly stable (though not perfectly so like Lucroy), but he dropped his head noticeably to follow the ball into the glove. All five pitches were called balls. Exaggerated glove and body movements are well known to be distracting to umpires. As Brent Mayne wrote in The Art of Catching: Simply catch the ball firmly. When the pitch and glove meet, that’s where the action should stop. The catcher should have enough strength to stop the momentum of the ball so that strikes don’t turn into balls. Think of a gymnast “sticking” a landing. Just “stick” the ball, hold it for a brief second, then throw it back. Lucroy and Molina have that technique perfected. Varitek, on the other hand, appears to have lost dozens of strike calls every year because he does not. I am not aware of any previous finding that the catcher dropping his head to follow a borderline pitch into his glove will cost him a strike call. However, I am convinced that it is an important factor making Doumit one of the worst receiving catchers in the majors. I have rarely, if ever, been able to identify such a striking mechanical difference between major-league players that has correlated so directly to performance differences. For the borderline pitches I reviewed where the catcher had otherwise quiet and stable mechanics, the presence or absence of the catcher head drop predicted the umpire’s strike call 31 of 32 times. Jeff Zimmerman and Kurt Romeiser reviewed video for strike calls lost by Zack Greinke in 2010 with Kendall and Pena behind the plate. This is the only other extensive review of catcher technique in conjunction with PITCHf/x data of which I am aware. They noted that some of the strikes were lost due to Greinke missing the catcher target or due to glove movement by the catcher. However, some of the calls they attributed simply to a blown call by the umpire. In at least a few of those cases, I note that the catcher dropped his head to follow the pitch into the glove. I welcome feedback on my findings from catchers, umpires, coaches, or other interested parties. There may be other mechanical factors that I did not observe that influence umpire strike calls. It is very helpful to be able to review the video in conjunction with using PITCHf/x pitch location data to identify borderline calls that went for or against the catcher. Catchers appear to have a substantial impact on the success of their pitchers through their ability to gain extra strike calls from the umpire. This is an important factor to consider when valuing the contributions of catchers to a team. We have identified at least two specific techniques that affect catcher performance in this arena. Given the important impact on major-league teams, further research along that line is warranted.
Mike Fast is an author of Baseball Prospectus.
|
This is the amazing stuff that make this site so great.