
 193 comments have been left for this article.
 BP Comment Quick Links

|

|
July 25, 2011 Manufactured RunsLost in the SIERA MadreRecently, there has been a lot of digital ink spilled about ERA estimators—statistics that take a variety of inputs and come up with a pitcher’s expected ERA given those inputs. Swing a cat around a room, and you’ll find yourself with a dozen of the things, as well as a very agitated cat. Among those is SIERA, which has lately migrated from here to Fangraphs.com in a new form, one more complex but not necessarily more accurate. We have offered SIERA for roughly 18 months, but have had a difficult time convincing anyone, be they our readers, other practitioners of sabermetrics, or our own authors, that SIERA was a significant improvement on other ERA estimators. The logical question was whether or not we were failing to do the job of explaining why SIERA was more useful than other stats, or if we were simply being stubborn in continuing to offer it instead of simpler, more widely adopted stats. The answer depends on knowing what the purpose of an ERA estimator is. When evaluating a pitcher’s performance, there are three questions we can ask that can be addressed by statistics: How well he has pitched, how he accomplished what he’s done, and how he will do in the future. The first can be answered by Fair RA (FRA), the third by rest-of-season PECOTA. The second can be addressed by an ERA estimator like SIERA, but not necessarily SIERA itself, which boasts greater complexity than more established ERA estimators such as FIP but can only claim incremental gains in accuracy. Some fights are worth fighting. The fight to replace batting average with better measures of offense was worth fighting. The fight to replace FIP with more complicated formulas that add little in the way of quality simply isn’t. FIP is easy to understand and it does the job it’s supposed to as well as anything else proposed. It isn’t perfect, but it does everything a measure like SIERA does without the extra baggage, so FIP is what you will see around here going forward. Why ERA Estimators? Why do we want to know a player’s expected ERA? We can measure actual ERA just fine, after all, and we have good reason to believe that ERA is not the best reflection of a pitcher’s value because of the unearned run. Component ERA estimators are frequently used to separate a pitcher’s efforts from those of his defense, but you end up throwing out a lot of other things (like how he pitched with men on base) along with the defensive contributions. Here at BP, we use Fair RA to apportion responsibility between pitching and defense while still giving a pitcher credit for his performance with men on base. Sean Smith, who developed the Wins Above Replacement measure used at Baseball Reference, has his own method of splitting credit that doesn’t rely on component ERA estimators. They simply aren’t necessary to handle the split credit issue. What about ERA estimators’ utility in projecting future performance? Let’s take a look at how the most popular component ERA works in terms of prediction. Fielding Independent Pitching was developed independently by Tom Tango and Clay Dreslough, and is simply: (13*HR + 3*BB – 2*SO)/IP +3.20 I computed FIP for the first 50 games of the season, from 1993 to 2010, and looked at how it predicted rest-of-season ERA, weighted by innings pitched. As expected, the Root Mean Square Deviation is very large, at 5.32. If you repeat the exercise but use previous year’s ERA instead, RMSE drops to 2.78. After 100 games, the difference still persists; ERA has an RMSE of 4.52, compared to 9.64 for FIP. (The reason RMSE goes up the further you are in season is that you are predicting ERA for substantially fewer games.) Large sample sizes are our friend when it comes to projection. All component ERA estimators share the same substantial weakness in terms of predicting future ERA: they work a lot better on smaller sample sizes. I tried predicting 2010 pitching stats using the aggregate of pitching stats from 2003 through 2009, so I could test how several ERA estimators fared as sample sizes increased dramatically. In addition to FIP, I used xFIP, a FIP derivative developed by Dave Studeman which uses outfield flies to estimate home runs allowed, and Skill-Interactive ERA, a metric originally developed here at BP by Matt Swartz and Eric Seidman. Here is the RMSE for 2003-2010 at increments of 100 innings:
Looking at all pitchers with at least 100 innings, SIERA outperforms the other estimators (but not by much, as I’ll explain momentarily) as well as ERA. By about 400 innings, though, the gap between the ERA estimators (as well as the gap between them all and ERA) has essentially disappeared. As you add more and more innings, plain old ERA outperforms the estimators, with basic FIP ranking second-best. If you want a projection, the key thing you want is as large a sample as possible. If you need both a large sample as well as the most recent data, weighted according to their predictive value, you want something like rest-of-season PECOTA. So what is the function of these estimators, if not prediction? The answer, I think, is explanation. These ERA estimators allow us to see how a pitcher came about the results he got, if they came from the three true outcomes, defense, or performance with runners on. Enter SIERA—Twice SIERA was doomed to marginalization at the outset. It was difficult to mount a compelling case that its limited gains in predictive power were worth the added complexity. As a result, FIP, easier to compute and understand, has retained popularity. FIP is the teacher who can explain the subject matter and keep you engaged, while SIERA drones on in front of an overhead projector. When FIP provides you an explanation, you don’t need to sit around asking your classmates if they have any idea what he just said. If ERA estimators are about explanation, then the question we need to ask is, do these more complicated ERA estimators explain more of pitching than FIP? The simple answer is they don’t. All of them teach fundamentally the same syllabus with little practical difference. Fangraphs recently rolled out a revised SIERA; a natural question is whether or not New Coke addresses the concerns I’ve listed above with old Coke. The simplest answer I can come up with is, they’re still both mostly sugar water with a bit of citrus and a few other flavorings, and in blind taste tests you wouldn’t be able to tell the difference. I took the values for 2010 published at Fangraphs and here, and looked at the root mean square error and mean absolute error, weighted by innings pitched. I got values of .12 and .19 respectively. In other words, roughly 50 percent of the time a player’s new SIERA was within .12 runs per nine of the old SIERA, and 68 percent of the time it was under .20 runs per nine. There is a very modest disagreement between the two formulas. In order to arrive at these modest differences, SIERA substantially bulks up, adding three new coefficients and an adjustment to baseline it to the league average for each season. I ran a set of weighted ordinary least squares regressions to, in essence, duplicate both versions of SIERA on the same data set (new SIERA uses proprietary BIS data, as opposed to the Gameday-sourced batted ball data we use here at Baseball Prospectus). Comparing the two regression fits, there is no significant difference in measures of goodness of fit such as adjusted r-squared. Using the new SIERA variables gives us .33, while omitting the three new variables gives us .32. We can go one step further and eliminate the squared terms and the interactive effects altogether, and look at just three per-PA rates (strikeouts, walks and “net ground balls,” or grounders minus fly balls) and the percentage of a pitcher’s innings as a starter. The adjusted r-squared for this simpler version of SIERA? Still .32. So what does the extra complexity of the six interactive and exponential variables add to SIERA? Mostly, multicollinearity. An ordinary least squares regression takes a set of one or more input variables, called the independent variables, and uses them to best predict another variable, the dependent variable. It does this by looking at how the independent variables are related to the dependent variable. When the independent variables are also related to each other, it’s possible to throw off the coefficients estimated by the regression. When multicollinearity is present, it doesn’t affect how well the regression predicts the dependent variable, but it does mean that the individual coefficients can incorrectly reflect the true relationship between the variables. This is why you can have one term in old SIERA with a negative coefficient now have a positive coefficient in new SIERA. The fundamental relationship between that variable and a pitcher’s ERA hasn’t changed, players haven’t started trying to score outs without making runs or anything like that. Adding additional complexity doesn’t help SIERA explain pitching performance in a statistical sense, and it makes it harder for SIERA to explain pitching performance to an actual human being. If you want to know how a pitcher’s strikeouts influence his performance in SIERA, you have no less than four variables which explicitly consider strikeout rate, and several others which are at least somewhat correlated with strikeout rate as well. Interpreting what SIERA says about any one pitcher is essentially like reading a deck of tarot cards—you end up with a bunch of vague symbols to which you can fit a bunch of rationalizations to after the fact. The world doesn’t need even one SIERA; recent events have conspired to give us two. That’s wholly regrettable, but we’re doing our part to help by eliminating it from our menu of statistical offerings and replacing it with FIP. Fangraphs, which already offers FIP, is welcome to this demonstrably redundant measure. FIP or xFIP? The next question is why not use a measure like xFIP instead of FIP? The former is much simpler than SIERA and performs better on standard testing than FIP, while being indistinguishable from SIERA in terms of predictive power. While xFIP is simpler than SIERA, it still drags additional levels of complexity along with it, including stringer-provided batted ball data. The question is whether or not that data adds to our fundamental understanding of how a pitcher allows and prevents runs. One of the fundamental concepts to understand is the notion of true score theory (otherwise known as classical test theory). In essence, what it says is this: in a sample, every measurement is a product of two things—the “true” score being measured, and measurement error. (We can break measurement error down into random and systemic error, and we can introduce other complexities; this is the simplest version of the idea, but still quite powerful on its own.) You’re probably familiar with the principle of regression to the mean, the idea that extreme observations tend to become less extreme over time. If you select the top ten players from a given time period and look at their batting average, on-base percentage, earned run average, whatever, you see that the average rate after that time period for all those players will be closer to the mean (or average) than their rates during that time period. That’s simply true score theory in action. Misunderstanding regression to the mean can lead to a lot of silly ideas in sports analysis. It’s why people still believe in a Madden curse. It’s why people believe in the Verducci Effect. It is why we ended up with a lot of batted-ball data in our supposed skill-based metrics. I’m regularly known as a batted ball data skeptic. So I’m sure it comes as no surprise that I regularly lose sleep over statistics like home runs per fly ball, a component of xFIP. xFIP uses the league average HR/FB rate times a pitcher’s fly balls allowed in place of a pitcher’s actual home runs allowed. While it’s true that a pitcher’s fly ball rate is predictive of his future home run rate on contact, it’s actually less predictive than his home runs on contact (HR/CON). Looking at split halves from 1989 through 1999[1], here’s how well a pitcher’s stats in one half predict his home run rate on contact in the other half:
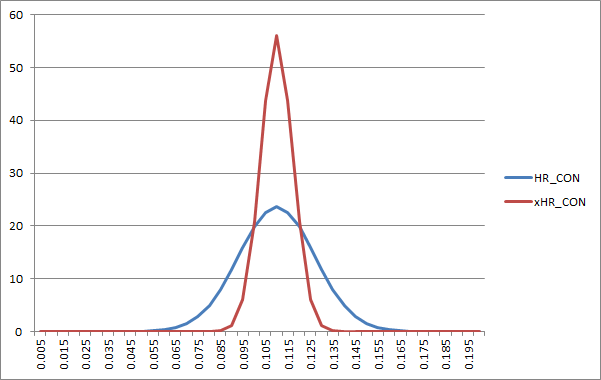
For those who care about the technical method, I used the average number of contact in both halves to do a weighted ordinary least squares regression. The coefficients on the regression including both terms are: HR_CON_ODD = 0.019 + 0.158*HR_CON_EVEN + 0.032 * FB_RT_EVEN This result seems to fly in the face of previously published research. Most analysts seem to feel that a pitcher’s fly ball rate is more predictive of future home runs allowed than their home run rates. How to reconcile these seemingly contradictory thoughts? The answer is simply this: estimating home run rates using a pitcher’s fly ball rates leads to a much smaller spread than using observed home run rates. Taking data from the 2010 season, and fitting a normal distribution to actual HR/CON, as well as expected HR/CON given FB/CON, gives us:
When you create an expected home run rate based on batted ball data, what you get is something that's well correlated with HR/CON but has a smaller standard deviation, so in tests where the standard deviation affects the results, like root mean square error, it produces a better-looking result, without adding any predictive value. Aside from questions of batted ball bias, however, there is a reason that this sort of analysis can be unsatisfactory: it assumes that a fly ball that wasn’t a home run is equally predictive of future home runs as a fly ball that is a home run. This is absolutely incorrect. You can break a pitcher’s fly ball rate down into two components: home runs on contact, and fly balls on balls in play. (This ignores the very small number of home runs that are scored as line drives, which is typically rare enough to not impact this sort of analysis.) Fly balls on balls in play are a much poorer predictor of future home runs than home runs on contact, with an r-squared of only .014. While regressing the spread of HR/CON is a good idea, using fly ball rates to come up with expected HR/CON does this essentially by accident. And in doing so, they throw out a lot of valuable information that is preserved in HR/CON but is washed out when non-HR fly balls are considered in equal proportion. By being in a rush to discard the bath water, someone’s throwing away the baby. No Estimating ZoneProponents of skill-based metrics such as SIERA and xFIP (as distinct from FIP) may claim that results trump theory, that their additional predictive value alone proves their utility. But just as the greater predictive value of fly ball rates is a mirage, so is the greater predictive value of skill-based estimators. What happens when we fit a normal distribution to our ERA estimators, along with ERA? Again looking at 2010 data:
The estimators have a smaller standard deviation than observed ERA. SIERA has a lower spread than FIP and xFIP has a lower spread than both (although SIERA and xFIP are much closer to each other than SIERA is to FIP). Let’s look at how well each of these predicts next-season ERA from 2003 through 2010 (using a weighted root mean square error), and well as the weighted SD of each among the pitchers who pitched in back to back seasons:
The ERA estimators are all closer to the next-season ERA than ERA is, but they have a much smaller spread as well. So what happens if we give all the ERA estimators (and ERA) the same standard deviation? We can do this simply, using z-scores. I gave each metric the same SD as xFIP, which was (just barely; you can’t even tell the difference when you round the values) the leading estimator in the testing above, and voila:
In essence, what we’ve done here is very crudely regress the other stats (except SIERA, which we actually expanded slightly) and re-center them on the league average ERA of that season. Now SIERA slightly beats xFIP, but in a practical sense both of them are in a dead heat with FIP, and ERA isn’t that far behind. As I said, this is an extremely crude way of regressing to the mean. If we wanted to do this for a real analysis, we’d want to look at how much playing time a player has had. In this example we regress a guy with 1 IP as much as a guy with 200 IP, which is sheer lunacy. In a real sense, that’s what we do whenever we use a skill-based metric like xFIP or SIERA. We are using a proxy for regression to the mean that doesn’t explicitly account for the amount of playing time a pitcher has had. We are, in essence, trusting in the formula to do the right amount of regression for us. And like using fly balls to predict home runs, the regression to the mean we see is a side effect, not anything intentional. Simply producing a lower standard deviation doesn't make a measure better at predicting future performance in any real sense; it simply makes it less able to measure the distance between good pitching and bad pitching. And having a lower RMSE based upon that lower standard deviation doesn't provide evidence that skill is being measured. In short, the gains claimed for SIERA are about as imaginary as they can get, and we feel quite comfortable in moving on. [1]The years in question are because those are the years for which we have Project Scoresheet batted ball data, and thus represents the largest period of publicly-available batted ball data on record.
Colin Wyers is an author of Baseball Prospectus. Follow @cwyers
|
While I enjoy some of the writing at fangraphs, this article demonstrates my problem - they just take existing stats, add multiple layers of complexity in an effort to extract another decimal point of accuracy, then declare it the be all and end all. No critical thinking about what problem they are trying to solve or what the extra accuracy would mean even if they did achieve it. They're like the Aperture Science of baseball analysis - throwing stats at the wall and seeing what sticks.
In the case of SIERA, there isn't any criticism you can make of Fangraphs that you can't make of us as well. I don't want this to be an "us versus them" issue; there are plenty of good baseball analysts over there as well as here.
I think the important thing is to evaluate the work on its own merits, regardless of the source - let the evidence be the guide. I started working on this before I had any inkling that Fangraphs would be picking up SIERA - unfortunately I was away for a while to attend SABR and so the article you see here got delayed. Once SIERA was released at Fangraphs, we delayed the article for a few days so I could review the changes they made and see if they addressed any of the concerns I outlined. As I note above, they didn't, so I incorporated some new material to mention that and we went with it.
I'm a little saddened that it worked out this way, actually - I don't think Fangraphs is adding anything that helps them communicate important baseball info, given that they were already running FIP to begin with. And I think that the way the timing of this happened, it puts the focus more on the personalities involved than on the quality of research.
At least Swartz is 100% transparent in what he is doing, and is very responsive to reader input. Contrast that with BP, which has apparently changed (improved?) PECOTA, but has published nothing to indicate what has changed or why. We were all expecting a massive research piece on what steps were taken to improve the algorithm this past off-season. Instead we got crickets and a late product.
Now we get an incredibly time-consuming rebuttal to someone's else's work on a different site. This off the heels of an even more off-target critique of Fangraphs' rest of season weighting algorithm. Exactly what weighting are you using again for PECOTA RoS, Colin? Oh wait: you never answered that repeated question, instead spending a whole article doing forensic analysis to uncover and slam someone else's algorithm.
I have no allegiance to Fangraphs or BP or any other site for that matter. But the trend here at BP is undeniably disturbing. More effort is being put toward saying someone else is wrong than it is toward creating and optimizing your own models and tools -- at least based on what is being published, which is all that really matters. The PECOTA pitcher win-loss projections were unbelievably screwed up, beyond any shred of credibility; the 10-year projections never came. But instead of reading articles about what happened and how it will improved for next year, we're reading about how some ex-employee should stop trying to improve a once-prized algorithm for estimating true pitcher skill over small samples? Color me saddened as well.
This almost exactly reflects my views. The 10-year upside projections - the only 10-year projections - were immediately identified as broken, and we got promised that it would be looked at. That got nowhere. BP isn't announcing that it's taking down the broken PECOTA's, or broken 10-year upside.
There are other problems I discussed in the last thread that I won't harp on further.
Unlike evo34, I have a dog in this fight; I've published twice on BP, I've been acknowledged in the book credits, and I've had a number of pleasant conversations with BP authors both live and via e-mail. I want BP to succeed.
But an article saying, "Math is hard; incremental improvement isn't useful," and a somewhat opaque statistical attack is either anti-stathead or appearing to stem from personal animosity.
Steven Goldman deserves some heat for this, too. There's a time when an editor needs to slow down the horses.
My comment above says or seems to say there are no 10-year projections now; that's wrong. My apologies.
That's right, actually--we've just released them to our Beta testers. Please have a look and let us know what you think, folks, and thanks again for your patience.
I fixed UPSIDE in April and it was on the player cards.
At some point since then - after the first week they were up, as we were giving it constant scrutiny during that stretch, they were overwritten somehow with the old values. This is quite embarrassing, and probably means that someone ran a piece of pre-season prep code which needed to be deactivated. I take full responsibility for it being removed. I'm not clear on why the customers who were most interested in seeing it fixed (such as jrmayne) were not appropriately informed when it was published in April, but obviously it wasn't handled professionally on our part at any stage.
All customer suggestions are read and discussed. Some are "works as designed". Some are not possible to be fixed / implemented in a timely manner. Pre-season PECOTA modifications would generally come under one of these two categories. Some suggestions lead to re-evaluation of statistical methods, such as this FIP/SIERA discussion evinces. But ones such as UPSIDE - which are simply repairing/restoring stats that have been on the online before - should be fixed in a timely manner. We'll make sure that any such future fixes are addressed in a timely manner, and that these solutions are communicated.
As some feedback for next season, I don't think the current presentation of UPSIDE is as useful as it has been in years past. I don't think most people care what the exact upside prediction for 2017 is (down to a decimal point); they would like an approximation of the player's total upside over the next 5 years, or 10 years. Upside used to be listed this way (as a total). Now it's either listed for 2011 only (in PFM and the PECOTA spreadsheet), or as a row of individual year numbers on the PECOTA cards.
Also, it was mentioned several times in the pre-season, but the order of tables in the PECOTA cards seems odd. The injury and contract info. tables, which are not of primary interest to most users and take up a ton of room, are listed above projected playing time, forecast percentiles, and now the 10-year forecast.
In terms of the Rest of Season PECOTA weighting, I offered an explanation here:
http://www.baseballprospectus.com/article.php?type=2&articleid=14171#88302
I'll be happy to try and expand upon that, if you can please tell me what you find lacking in that explanation.
Bayesian priors are in my wheelhouse. I am absolutely convinced that's the right way to do it. All good there.
But this is from the July 19 thread:
Rest-of-season PECOTA: We've made changes to the weighting of recent results that reduced the impact of 2009-2010 performance on players' rest-of-season projections, making them less susceptible to being swayed by small-sample stats. Those changes are now reflected in the "2011 Projections" table at the top of each player card, as well as in our Playoff Odds.
[End quote]
And several people noted that you'd previously said that Fangraphs was wrong for its too-2011 heavy stats. While the paragraph was parsed different ways (and we never found out which way was right - the logically coherent and grammatically coherent readings appear at odds), it appears to say that prior years are having their weighting reduced, to get closer to Fangraphs' weightings. (Yes, Fangraphs is doing something else that appears mistaken, but you vigorously stressed the goal of not overselling recent performance.)
So:
Step 1. Fangraphs is wrong! They're weighting 2011 way, way too much! Dummies.
Step 2. The approximate weighting Fangraphs is using for 2011 (for players with similar PT rates in each year) looks right to some of the unwashed masses.
Step 3. We've changed our system to weight prior years less (and, by necessity, 2011 more.)
Either Step 1 or Step 3 has a flaw. What I want to know is if I've misread Step 3.
--JRM
I'll ask Lindbergh and Wyers again: what was changed in the PECOTA rest-of-season weighting scheme a few days ago, and why was it done?
"And I think that the way the timing of this happened, it puts the focus more on the personalities involved than on the quality of research."
Then why on earth is this being published now, at the very same time the former BP author is writing about this stat on a different website? Why not two weeks ago? Or in August? Or in the off-season? I hardly believe switching from SIERA to FIP is an urgent change that must be made and justified this very second unless there's some sort of legal/IP issue involved, in which case just say that. Doing this now seems intentionally confrontational and needlessly petty.
Is Colin supposed to wait until some appropriate amount of time has elapsed, out of respect? We're all big boys here. We can have this debate and not worry about hurting feelings.
Well, we can have this debate but it sounds like feelings may already be hurt.
Feelings should not enter into it. As Sonny says in "The Godfather," it's business, not personal. While no author likes to see his work criticized, criticism comes with the territory when you start performing in public. You receive your bouquets and your brickbats and you move on. I believe it was Evelyn Waugh who said that he sometimes let a bad review spoil his breakfast but never his lunch. In any case, it is product, not people, under discussion here.
Whether it was business or personal, to me it would've made more sense to either "phase out" SIERA quietly or retire SIERA after the season.
Not that it necessarily applies to the conversation, but I never liked that quote. Every person I've run into whose said "it's not personal, it's business," seems to be hiding behind that quote in order to do something that's personally tasteless.
Completely irrelevant thought. I just don't like that axiom.
I blame this whole situation on Wieters being called a bust.
http://writing.colostate.edu/guides/researchsources/includingsources/quoting/overusing.cfm