


 23 comments have been left for this article.
 BP Comment Quick Links

|

|
March 18, 2011 Baseball ProGUESTusLooking at Pitches Through the Batter's EyesBelieve it or not, most of our writers didn't enter the world sporting an @baseballprospectus.com address; with a few exceptions, they started out somewhere else. In an effort to up your reading pleasure while tipping our caps to some of the most illuminating work being done elsewhere on the internet, we'll be yielding the stage once a week to the best and brightest baseball writers, researchers and thinkers from outside of the BP umbrella. If you'd like to nominate a guest contributor (including yourself), please drop us a line. Matt Lentzner has carved out a (very) small niche in the baseball analysis world by examining the intersection of physics and biomechanics. He has presented at the PITCHf/x conference in each of the last two years and has written articles for The Hardball Times. When he’s not writing, Matt works on his physics-based baseball simulator, which is so awesome and all-encompassing that it will likely never actually be finished, though it does provide the inspiration for most of his articles and presentations. In real life, he’s an IT Director at a small financial consulting company in the Silicon Valley and also runs a physical training gym in his backyard on the weekends. We face something of a paradox with PITCH/fx data. If I were to ask you which pitch had the most break, what would you say? Curveball? Slider? The PITCH/fx expert would correctly identify the four-seam fastball. According to the way PITCHf/x evaluates pitches, fastballs consistently boast the biggest breaks. That seems crazy. It certainly looks like the fastball is the straightest pitch. Hitting data backs this up: batters swing and miss at fastballs much less often than they do at other pitch types, including sliders, which typically yield the lowest break figures according to PITCHf/x. For a supposedly “straight” pitch, sliders look pretty darn crooked. In fact, many batters feel that the slider on the black is one of the hardest pitches to hit. Let’s take a look at some pitch trajectories and see why this is the case. (Note: these graphics are more illustrative than accurate, and they are are greatly foreshortened to reveal the relevant effects.) Here’s a fastball:
As you'll notice, the fastball's path is highly curved. But also notice that by the time the heater reaches the plate, it has straightened itself out. From the batter’s perspective, the fastball proceeds down the center line of the plate; it looks straight because its lateral movement counteracts the offset due to its release point. Here’s a slider:
In this case, the path is straight. But to the batter, the ball appears to be “sliding” across the plate. A slider looks crooked because the offset from its release point is not counteracted by its lateral movement. Up to this point, PITCH/fx analysis has treated the ball itself as the reference point. When we say that a ball broke 11 inches, we mean that it deviated that distance from the expected path of a pitch where the spin is ignored—in other words, a trajectory considering only gravity and air resistance, and not the Magnus effect caused by the spin of the ball. This is technically accurate and reflects the approach a physicist would adopt. The problem with measuring pitches that way is that it has very little relevance to baseball. Who is most concerned with the movement of the ball once it has been pitched? The batter. We should be looking at things through his eyes, so he has to be the reference point. As it turns out, adjusting the reference point is not that difficult. It is a happy coincidence that the PITCH/fx coordinate system is aligned with home plate, since generally speaking, so is the batter. And what is the batter concerned about? Velocity in his frame of reference—in other words, how fast the ball is moving toward him, away from him, down, or up.
The greater the magnitude of those velocity arrows, the harder the pitch is to hit. Looking at the pitch from the batter’s frame of reference reveals the importance of pitch location. A slider thrown to the arm side of the plate "slides" less than a slider thrown to the glove side of the plate, like so:
A ball following the blue path would be moving away from a right-handed batter faster than a ball following the pink path. Differences in pitch height produce similar effects:
As the above image indicates, a pitch thrown high in the strike zone moves downward much more slowly on its way to the plate than a pitch thrown low in the zone. If two identical pitches were thrown to different heights in the zone, the lower one would move downward faster simply because it has to travel further toward the ground in the same amount of time. (I’m ignoring the effect of gravity here, so keep in mind that trajectories representing actual pitches would be curved.) With all of this theory in place, I asked PITCHf/x guru Mike Fast to run some numbers. The following graph reveals how the vertical velocity component affected the rate of whiffs per swing for all pitches recorded by the PITCHf/x system during the 2008, 2009, and 2010 seasons:
Mike and I discovered that a descent angle of -7 degrees was best for the batter: the further a pitcher's offerings could diverge from that angle, the more effective they would be. What should be noted is that if Justin Verlander were to throw his fastball at knee height instead of at shoulder level, it would slide down toward the low point in the graph and make for a less effective pitch. Conversely, if Adam Wainwright were to hang his curve, it would become an inferior pitch even if all of its other components—the spin, velocity, etc.—were exactly the same as those of the devastating knee-high version. (Of course, Wainwright will have to complete his recovery from Tommy John surgery before he can contemplate throwing curveballs of any kind.) Why is an angle of -7 degrees so beneficial to the batter? Mike and I believe that it corresponds to the typical uppercut of a batter’s swing. When a pitch is moving downward at that angle, the plane of the swing and the plane of the ball are aligned, and the bat stays in the hitting zone longer. It might be revealing to analyze how this graph varies from batter to batter. Are “low ball” hitters biased toward steeper pitches than “high ball” hitters? It’s interesting that while left-handed batters have a reputation for preferring the ball in different locations than right-handed hitters, their curves above appear similar—identical for fastballs (on the left side of the graph), in fact. Lefties appear to be better overall against breaking pitches (on the right side of graph), but remember that they have a platoon advantage here, since we are looking only at right-handed pitchers. That’s an exceedingly neat-looking graph. Unfortunately, its counterpart for the horizontal velocity component wasn't quite as cooperative:
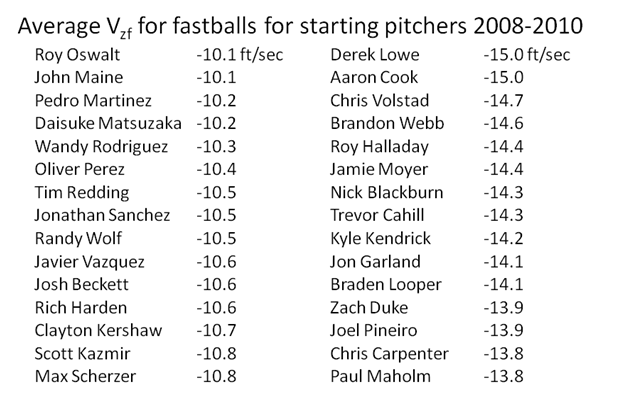
This graph looks much like we'd expect it to for RHP vs. RHB but a bit funky for RHP vs. LHB. Even the RHP vs. RHB graph doesn’t quite attain the symmetry of the vertical component graph. Mike and I are still attempting to decipher why this might be, but I think it has to do with pitch velocity. In Robert Adair’s book, The Physics of Baseball, he presents a theory that purports to explain what makes pitches effective. Essentially, the idea is that the pitcher wants to compound the batter's errors instead of canceling them out. For example, the batter is likely to be late on a fastball. Consequently, the pitcher would be wise to throw his heater inside in order to jam the batter and prevent him from getting around on the pitch. Likewise, it is better to throw a breaking ball away, because the batter will tend to be early and pull off on the slower pitch. If a pitcher throws his fastball away and his breaking ball inside, then these effects tend to cancel out. A batter who is late on an outside fastball will be in a good position to go the other way with it, while a batter who is early on an inside breaking ball will be in a good position to pull it. It’s no wonder that hanging sliders tend to get killed. This confounding factor may be making the horizontal component graph less smooth. We need a way to separate pitches that the batter is likely to be late on from those that he is likely to be early on, and I haven’t figured out a slick way to do that yet. Batter expectation is a big factor; it’s not as simple as cutting the population of all pitches in half. Jamie Moyer was known to jam batters with his low-80s fastball when they were expecting a changeup, so we'd have to divvy up his pitches differently than we would for a hard thrower like Verlander. These curves could look lumpy because they depict two distinct sets of data overlaid on top each other, and I’m open to suggestions for how best to break them out. Mike also generated a list of pitchers who had the least and most vertical movement on their fastballs from 2008-2010:
Keep in mind that these numbers do not simply represent the break on the pitch—location plays a role as well. Throwing fastballs high in the strike zone makes them play up, or "hop." Throwing sinkers low makes them "heavier" and harder to elevate. Looking at standard PITCHf/x break values for fastballs and sinkers makes it difficult to distinguish pitchers who primarily ply their trade with one from those who rely upon the other, but this method clearly differentiates between the two breeds. So what ramifications does our new frame of reference for looking at pitches have? A lot, actually. We can now understand why “hanging” pitches seem to hang: they are literally moving downward more slowly than a pitch thrown low, which makes them easier to hit. If they are descending at a nice -7 degree slope, they are likely to get clobbered. We can also see the effect of pitching from different sides of the rubber. If you want to play up your breaking stuff, then move to the arm side. If you want to enhance your faster stuff, then move to the glove side. Would it make sense for a pitcher to shift his position on the rubber based on the batter and the upcoming pitch? Probably not. For one thing, he'd be tipping off his strategy. More importantly, doing so would probably hamper his control; it's hard enough to hit the target from a stationary base. That said, a slider-throwing LOOGY (left-handed relief specialist) might want to stand at the left edge of the pitching rubber to get the most out of his primary weapon. Here’s an amazing graph that Mike made using our batter reference point analysis by bucketing all Tim Lincecum pitches captured by PITCHf/x over the last four seasons by their vertical component velocities. The y-axis is the frequency of each bucketed group.
Let’s call that vertical dotted line the “meatball” line. It corresponds to the dreaded -7 degree descent angle, so the closer a pitch was to that line, the easier it was to hit. We can see that Lincecum’s 2008 and 2009 seasons were almost identical and represented a marked improvement over his 2007 rookie campaign, since the largest groupings of pitches in 2008 and 2009 were farther away from the “meatball” line than the 2007 hump. By 2010, Lincecum looked like a completely different pitcher: the fastball bump on the right side had disappeared, and he started throwing more sinking pitches. He still threw a lower proportion of “meatball” pitches than he had in 2007 (which is good), but more than he had during 2008 and 2009. I’d say that this graph suggests that Lincecum has lost some ability; he certainly wasn’t pumping the high heat like he used to in 2010. As cool as this Lincecum graph is, we’re just scratching the surface here. Making the batter the reference point opens up an entirely new avenue of analysis using PITCHf/x data. So in the final analysis, is a fastball a straight pitch? From the batter’s frame of reference, absolutely. Even though it has plenty of break according to standard PITCHf/x measurements, that break works to counteract both the natural offset of the release point and the downward effect of gravity. A slider does neither and appears pretty nasty as a result. In order to accurately evaluate a pitch, we have to look at it the way a batter does. This piece expands upon a Powerpoint presentation I delivered with Mike Fast at the 2010 PITCHf/x conference. Many thanks to Mike, whose input and assistance with the data made this analysis possible.
|
Mind. Blown.
I shall henceforth nickname Russ Ortiz "-7 degrees"