
 38 comments have been left for this article.
 BP Comment Quick Links

|

|
March 11, 2011 Prospectus Hit and RunA Quality Stat, Better than WinsMurray Chass is at it again, or perhaps he never stopped. I'm not sure, as I'll admit an aversion to reading the blog of a writer who years ago declared his loathing for the form and its practitioners, but now dwells in that very ghetto himself since being laid off by the New York Times. Chass has made noise twice in recent weeks via missives bemoaning the diminishing primacy of pitcher wins and assailing the so-called "new-age thinking" of anyone who would introduce more modern measures, be they VORP, WAR(P), or quality starts. Even the latter, which was introduced by Philadelphia Inquirer columnist John Lowe back in 1985, is too newfangled for Chass' tastes. In mid-February, Chass took umbrage at the $2.025 million arbitration award which the Pirates' Ross Ohlendorf received following a hard-luck season in which the 28-year-old righty won one game while losing 11, albeit with a respectable 4.07 ERA. "[T]imes have changed for pitchers. They don’t have to win games any more. Just throw some good-looking statistics out there other than wins, and they can win Cy Young awards and salary arbitration cases," he wrote. Never mind that even while battling back and shoulder woes, the Dorf's season was actually quite similar to his 2009 campaign, which featured a superficially more impressive won-loss record:
Ohlendorf's peripherals fluctuated from one year to the next, but all told, he outdid his SIERA by more than half a run in both years thanks to above-average defensive support. The biggest difference between his two seasons is that in 2010, he finished in a virtual tie with Johan Santana and Ryan Rowland-Smith for the honor of being the majors' worst-supported starter among those with at least 20 turns. To hear Chass tell it, this is evidence of the breakdown of society: Under this new-age thinking, if a team doesn’t score more than three runs a game, a pitcher isn’t expected to win. No longer is a pitcher expected to win 3-2 or 2-1. If his team doesn’t score at least four runs, it’s not the pitcher’s fault if he doesn’t win. Elsewhere in that piece, Chass bemoans the intricacies of the arbitration process, an irony given that he made his mark by pioneering the coverage of the business side of the game during the heyday of Marvin Miller, eventually earning the J.G. Taylor Spink Award. He stops short of calling for the abolition of arbitration, but it's clear from his insinuating tone that he's choking down every explanation for the pitcher's arbitration victory—including reliance on such arcane stats as ERA, innings pitched and run support—offered by those close to the case with the enthusiasm of a man forced to eat worms covered in boogers. Cheer up, Murray, is it really as bad as getting the Fire Joe Morgan treatment? Last week, Chass again took up arms against the quality start (among other things) in an article titled "Pampered Pitchers and Their Enablers." He even talked to the stat's creator: “I got the idea in 1983 and ’84,” Lowe said. “I was hearing managers saying they were looking for six innings from their pitchers. I heard Whitey Herzog say ‘all I want from my pitchers is six good innings.’” Elsewhere in the piece, Chass lauds the won-loss record and the durability of Warren Spahn, who ranks sixth on the all-time wins list (and fifth on the pitcher WARP list) and who still excelled in his early Forties. He echoes some valid points in terms of the way modern pitchers are conditioned (five-day rotations, pitch counts, and so on) relative to their forebears, but flogging them for the sake of exalting an outlier who retired just shy of half a century ago isn't a terribly convincing argument. Who's going to tell him that nobody hits like Ted Williams anymore, either? In any event, with the quality start no spring chicken, it's worth looking back at its relationship to modern pitching history in order to clear up some misconceptions about the stat and its utility. Via Chass and his allies, the chief complaint about the stat what we'll call the 4.50 Case, the times when a pitcher surrenders exactly three runs in six innings. I've argued elsewhere that the stat should be expanded to include starts in which a pitcher surrenders four earned runs in eight or more innings, and one can certainly take issue with the preservation of the artificial distinction between earned and unearned runs in this not-so-new metric, but for now, we'll stick with Lowe's definition so as to keep comparing apples to apples. That 4.50 game ERA is higher than the major league average in all but eight of the last 61 seasons (as far back as Baseball-Reference.com's quality start data goes), so one can understand some of the resistance to hanging a "quality" tag on such an effort, but it's also true that such cases are infrequent. Last year, 4.50 Case starts made up just 8.5 percent of all quality starts, and 4.5 percent of all starts. Those pitchers' teams went 98-122 in those games, for a .445 winning percentage. Historically speaking, all of those figures are relatively high. Since 1950, the 4.50 Case starts have constituted just 5.9 percent of quality starts and 3.0 percent of all starts. Their frequency fell below 10 percent in the former category for the first time since 2005, a development that had plenty to do with the major league scoring rate (4.38 runs per game) falling to its lowest level since 1992. From 1950 onward, teams have won at a .419 clip in such games, but while team winning percentages fell below .333 no less than 15 times between 1950 and 1972, they've been that low in just two seasons since (1976 and 1981) and have reached .500 in just four seasons (1994, 2000, 2007, and 2008). That the strike-torn 1981 and 1994 seasons wind up among the outliers is duly noted; they may owe their presence on the list to smaller sample sizes. The takeaway is the same: teams don't win all that many of those 4.50 Case games, but those games make up only a small portion of quality starts. What should be fairly obvious given all of the above is that the frequency of quality starts is heavily dependent upon scoring rates. In fact, it tracks almost perfectly. From 1950 through 2010, the correlation between the major league scoring rate and the overall percentage of quality starts is -.94. When the scoring rises, the quality start percentage (QS%) falls just as surely as God made little green apples for teenagers to chuck at Chass' proverbial front porch. Note the way the two lines mirror each other:
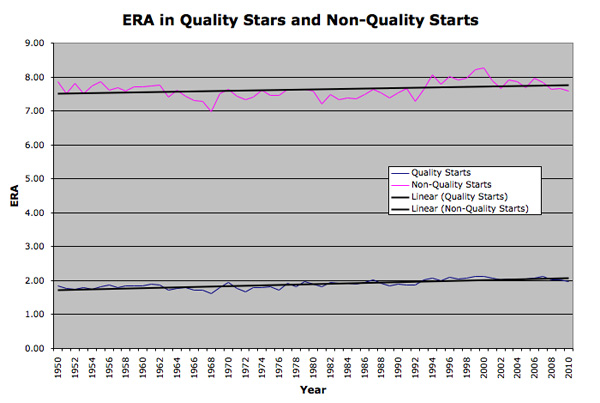
The highest QS% was in 1968, the Year of the Pitcher, when teams scored just 3.42 runs per game—the lowest scoring level since 1908—and 62.6 percent of all starts were quality starts. The lowest QS% was in 1996, when teams averaged 5.04 runs per game—the highest level since 1936—and 45.8 percent of all starts were quality starts. In 2000, when scoring crested at 5.14 runs per game, just 46.3 percent of starts were quality starts. With runs per game falling, last year was the first time since 2005 and just the second time since 1993 that the QS% rose above 50 percent. Overall, the linear relationship between scoring rate and quality start percentage is described by the line y = -0.094x + .9263, where x is the scoring rate and y the frequency of such starts. In an environment of 4.0 runs per game, we'd expect 55.0 percent of starts to be quality, with the percentage dropping to 50.3 at 4.5 runs per game, and to 45.6 percent at 5.0 runs per game, very close to our actual observed percentages. Regardless of the scoring rate or the era, pitchers making quality starts have collectively kicked ass. The combined ERA of starters in all quality starts in a given season has ranged from 1.63 in 1968 to 2.13 in 2000—yes, the two most extreme years again—with an overall average of 1.90. It rose above 2.00 just once from 1950 through 1992, coming in at 2.03 in the anomalous 1987, when the major-league scoring level (4.72 runs per game) rose higher than in any other season in a 43-year stretch (1951-1993). From 1993 through 2009, the ERA in quality starts was a smidge above 2.00 in every season save for 1995 (1.99); it dipped to 1.98 last year. Meanwhile, the combined ERA of starters in all non-quality starts has ranged from 6.98 (terrible) to 8.25 (godawful), with 1968 and 2000 again representing the extremes; 7.65 is the average, and 7.58 was last year's figure, down just a whisker from the previous two seasons. It topped 8.00 in four seasons (1994, 1996, 1999, and 2000). Graphically speaking:
Note that these ERA splits aren't all that different from what we see when looking at all pitcher ERAs in wins and losses. In 2010, pitchers posted a combined 1.96 ERA in wins, and 7.69 in losses. At the height of scoring in 2000, the numbers were 2.39 and 8.53; at the nadir in 1968, they were 1.36 and 5.22. As you might expect, pitchers who deliver quality starts pitch deeper into games than the average starter. From 1950 through 1963, they averaged over 8.0 innings per start, and hovered just under that mark for the over another decade. As late as 2000 they were still consistently over 7.0 innings per start, while for the past decade, they've hovered between 6.82 and 7.01 per start, landing at 6.89 last year. Meanwhile, the average number of innings pitched in all starts has decreased from a high of 6.76 per inning in 1952, to a low of 5.79 in 2007; it's been below 6.0 in all but one year since 1995, but it did rise back to 5.98 last year. In general, quality starts hovered around 1.7 innings longer than the average start in the 1950s, slipped below 1.5 innings longer per start by the late 1970s, and spent the last decade falling from 1.07 innings longer to 0.91 last year, the first time it slipped below 1.0. Still, longer is good, and these guys work overtime. In turn, pitchers delivering quality starts have left their teams with excellent chances of winning. Since 1950, teams have won at a .677 clip in games where they received a quality start, with the range running from .642 in 1968 to .717 in 1950. It hasn't been above .700 since 1958, when scoring was just 4.28 runs per game, but it was above .680 11 times from 1994 through 2007, with a high of .698 in 1996, when as noted before, scoring broke the 5.0 runs per game ceiling. The correlation between scoring rates and team winning percentage in quality starts is .71; the two are less directly tied together, but still more than a bit related. While one might expect falling innings-per-start averages and complete game percentages to help explain the rest of the variance—perhaps pitchers not doing all the work their own damn selves harm their teams' chances of winning—such correlations surprisingly don't hold up. The correlation between team winning percentage in quality starts and annual complete game percentage is a negligible .06, and that between team winning percentage and annual average innings per start is -.15, meaning that the percentages actually fall with rising inning rates such as those observed in the first half of the '70s, when they were at their highest in two decades. In any event, the fact that teams win about two-thirds of the time when they receive quality starts is impressive enough. Simplistic though it might be, the quality start metric has value. Over the past 61 years, the worth of a quality start has fluctuated in a relatively narrow range depending upon overall scoring levels (which to say the least are influenced by more than just the quality of pitching). No matter what the scoring level, the practitioners have collectively delivered elite-level ERAs around 2.00, with less than 10 percent producing the six-and-three performances over which detractors such as Chass obsess, and they've consistently left their teams in position to win even if they haven't been able to collect the W themselves. As for individual pitcher wins, we're not going there again today, except to point out that their decreasing stature owes plenty to the rising offensive levels, deeper lineups, longer at-bats, and increased reliever specialization which have made complete games largely a thing of the past. With the AL Cy Young awards going to Zack Greinke in 2009 and Felix Hernandez in 2010, it's clear that even most mainstream writers understand this, though some still cling to the bygone era. For sure, the quality start metric could be improved by including unearned runs and expanding to eight-inning cases, or replaced entirely with something better. Here at Baseball Prospectus, we're partial to the Support-Neutral Winning Percentage (found on this leaderboard), which tells you how often a team would win a pitcher's starts given average offensive and bullpen support, but that's a story for another day. The humble quality start metric is doing a laudable job of recognizing quality, and it deserves better than the abuse it sometimes receives.
|
Jay,
Nice piece. Any chance BP will add Quality Starts to the pitcher statistics files?
I'm hopeful that at some point we can add a BP-defined quality start incorporating unearned runs and eight-inning cases, but there are bigger fish to fry at the moment. And as I said above, I'm quite a fan of our Support Neutral Winning Percentage, which tracks pretty well with QS%. Among ERA qualifiers (162 IP), the correlation between QS% and SNWP was .79 in 2010.