

 41 comments have been left for this article.
 BP Comment Quick Links

|

|
January 19, 2011 Manufactured RunsThe Twilight of the GodsLet’s talk about the power of myth. A myth, simply put, is a story that is meant either to explain why something is, or to tell us how something ought to be. (Strictly speaking, myths are religious in nature, but we’re going to go ahead and stretch the word just a bit here.) It’s a story that teaches us something—a parable, if you will. But it starts off with a story. Baseball, I think, lends itself particularly well to stories. And I have a fondness for baseball stories. Consider, for instance, this game between the Red Sox and the Devil Rays back in ’04, the second game of a late-April double-header. It wasn’t a particularly dramatic game, I’ll grant you that. The Sox scored seven runs in the first inning, and the D-Rays never seriously threatened after that. Still, a seasoned baseball fan can go over the box score and construct a story from it. It’s something you pick up with practice. Still, you can find other kind of stories, too. Here’s a quick little excerpt from novelist Stewart O’Nan, a Sox fan, who was at the game:
That’s a story. (It’s from Faithful, an account of the ’04 Red Sox season by O’Nan and Stephen King. If you like baseball stories for their own sake, it’s worth your time.) Baseball stories have a tendency to spill over into myths, but what’s interesting–to me at least–is that this isn’t usually done with intent. Nobody set out to turn Babe Ruth into a mythic figure; they certainly meant to celebrate him, but he turned into myth on his own. This, I think, gives a lot of insight into why steroids send people into great spasms of moral righteousness, while amphetamines do not–the so-called steroid era was a sort of Gotterdammerung for some of our greatest baseball myths, as mere humans toppled the records of the pantheon of baseball immortals. Sportswriters can forgive many sins, but not that one. One of baseball's great myths, I’m sorry to say, is the myth of the closer. This is not to say that closers don’t exist, or that they can’t be valuable, but their role has taken on mythical qualities. We are told that these are the players that save the game, as though the game were some damsel in distress tied to the railroad track or hurtling over Niagara Falls in a barrel. They are, in short, the heroes. Yet nobody ever stopped to ask—did the game ever really need saving? Has the closer changed the game of baseball? Baseball experienced a change in Oakland, starting in 1988–that’s when Dennis Eckersley became the first pitcher that we’d recognize as the modern closer, as opposed to the more traditional “fireman” sort of ace reliever. Now it’s nearly unthinkable that a team would go without a designated closer, a pitcher whose primary role is to pitch in the ninth inning when his team has a lead of three runs or fewer. An interesting side note here–managers of course are doing this to bring in their closer during official save situations. So who decides what an official save situation is? The guidelines for what are and are not a save spot were first conceived by Jerome Holtzman, a beat writer covering the Cubs at the time. It was introduced in the Sporting News, later becoming an official MLB statistic, and now managers organize their entire bullpen around the idea of it. Isn’t that something? Is any sabermetrician so slavishly devoted to the precise definition of any one stat as managers are to the save? So now we have a battalion of pitchers whose sole purpose is to preserve close leads in the ninth inning. Has this innovation, in fact, made those close leads any more secure? What I did was take a look at how often a team allowed zero runs in an inning–call it the “clean rate.” Then I looked at clean rate only in the ninth inning when the batting team trails by exactly one run. The ratio of the two provides us with a measure of pitching effectiveness in potential save spots–-the toughest kinds of saves, even–-that controls for changes in run environment over time. So, going back to 1950, we can see a very slight uptick in our normalized clean rate:
Let’s use 1988 as our boundary year. From 1950 to 1987, the average normalized clean rate was 1.03. From 1988 to 2010, it increased to 1.06. From 1993 to 2010 (in other words, the current era of offense), it was 1.07. Now, from ’93 on, the average clean rate was 71 percent. So if we apply the pre-closer rate, we are led to think that roughly 73 percent of all one-run leads in the ninth would be safe. Applying the rate observed over that time period, we get 76 percent. On average a team had 15 such close leads to protect over the course of a season, so the modern innovation of the closer has allowed teams to preserve one additional one-run lead in the ninth inning every two seasons or so. Of course, this doesn’t look at two- and three-run saves (excuse me while I get in just one more eyeroll at the idea of a three-run save), extra-inning saves, or managers who have the audacity to bring in their best relief pitcher in some inning other than the ninth. Of course, we also haven’t accounted for the fact that sometimes a team will come back to win after allowing a team to tie up a one-run game in the ninth. Moreover, it doesn’t count the lost opportunities that come when you cut the innings you’re willing to use your best reliever in half. While teams have gotten better at holding close leads in the ninth, they’ve gotten worse about having a close lead to protect in the ninth–looking at the number of one-run leads in the ninth inning per game:
The games we’re asking closers to save just aren’t there anymore. Now, plenty has changed in baseball over the past 60 years–I’m not sure this is attributable at all or in part to the change in reliever utilization–but the fewer close games teams take into the ninth inning, the less valuable your typical closer can be. Now, this is probably a bit of an exercise in flogging a dead horse; Baseball Prospectus readers over the years have been told early and often that saves are overrated and a poor method for evaluating relievers. What interests me, though, is why so many people ever embraced the save to begin with. I think the save is a reflection of how we feel; the last out of the game is a collapsing state, where we know whether a team has won or lost. There is a great emotional impact to that certainty–joy in the win, frustration with a loss. But the cold hard fact is that you need 27 outs (with, of course, a lot of caveats) to end a ballgame, and each of them is just as important at the end of the day. The real problem isn’t the save rule. As an official stat, it’s far from dead, but there’s little profit in continuing to defang it. It shall expire on its own, in the fullness of time. The trouble is that, in the effort to urge the save’s demise along, sabermetrics is in danger of instead recreating it. Great Expectations Let’s talk win expectancy. Win expectancy, to state the obvious, is how many wins you expect, given what you know at the time. A typical win expectancy table will include the inning, which side is batting (home or away), the score differential (home runs minus away runs), the number of outs in the inning and the configuration of the runners on base. Going from this point forward, we’ll be looking at it in terms of the home team’s win expectancy (although you could certainly do it the other way around). Here a truncated sample of a win expectancy table from our stat report:
A full listing of run expectancy at every game state would take up pages and pages–this is just a smattering. (Since we’re looking at the top of the first, we can helpfully exclude all scenarios where the home team is trailing, as negative runs simply aren’t possible.) But just to pull out an example, a team with runners on second and third, no outs, at the top of the first with one run already scored has a 57 percent win expectancy. Loading the bases after that increases the odds of a victory to 82 percent. The difference between the two is the change (statisticians like to use the fancy word “delta”) in win expectancy, or in this case, 25 percent. (Note that I’m just subtracting, not taking the product or anything.) What I want to emphasize is that win expectancy is a prediction–it expresses the probability of a win. And that probability will tend to go up as the game goes on. Consider the average distance of the current win expectancy from .500, according to the number of batting outs the home team has recorded:
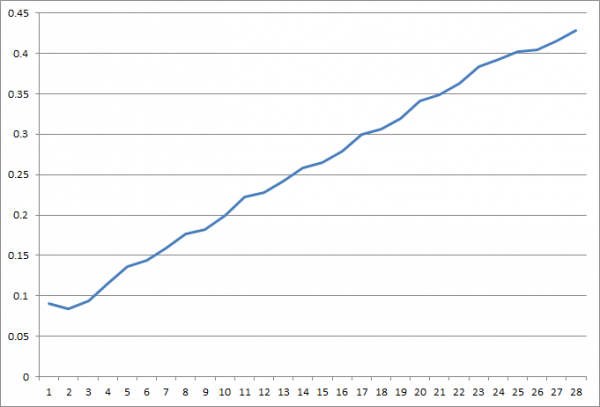
Over the course of a game, win expectancy tends to grow closer to either one or zero, depending of course on whether the home team is faring well or poorly. This is because our certainty in the outcome becomes higher the closer we get to the final out. What I want to emphasize is that the arrow of causation runs in one direction. Consider the very start of a game where the batter leads off with a double. That gives us a change in win expectancy of .085. Now suppose the next batter also hits a double; the change in win expectancy is .224. In other words, the second double appears to be about 2.6 times as valuable as the first. It helps if we remember what win expectancy is: a prediction of the final outcome of the game. The second double tells us much more about the final outcome of the game than the first does, but in terms of scoring that one run, each is equally as valuable; if that one run is decisive, each double is equally responsible for the outcome. If you replaced the first double with an out, it has the exact same impact on the game outcome as if you replaced the second double with an out. But because of the way we’re measuring things, there’s no way for us to account for the way the second double changes the value of the first, and no way to avoid attributing some of the value of the first double to the second. This isn’t necessarily a flaw in win expectancy–it is accurately reporting the current probability of a win, given its input parameters–but it is a flaw in attributing the entirety of the change in win expectancy to the player currently standing at the plate. So we’ve looked at how the first plate appearance of the game affects the second, in terms of in expectancy–but isn’t limited to that. You have effects of the first plate appearance on the second, but also the third, fourth, fifth… there's a cascade all the way down the line. The more PAs you add to the chain, the harder it is to discern the effect of one from another. The Archimedes Problem Another way to consider the problem is in terms of the potential change in win expectancy in any given plate appearance–it’s the idea of leverage. There are a few different ways of calculating leverage; here at BP we’ve used LEV, while at Fangraphs and Baseball-Reference.com they use Tom Tango’s Leverage Index. While the methods do differ in some regards, the core principles we’re discussing here remain the same. What leverage (in whatever form it comes in) tells us is how much of an effect that plate appearance can have on the prediction of the game outcome. Plate appearances in close games (especially close and late) have a greater effect on our expected outcome than plate appearances in games with a large run differential between the two teams, and this is truer the later in the game it gets. Leverage is derived from win expectancy, so everything we’ve said about that carries over to leverage. Leverage travels in only one direction; players can create or destroy leverage for the players after them, but they cannot benefit in the same way from the actions of the player after them. That’s the most important point about leverage: it isn’t a fixed quantity. If it were, it would be as simple as looking at high-leverage situations and who performed well in them. But there’s an additional consideration, and that’s how well a player did in creating leverage for his teammates. Closers, by the very nature of their role, pitch largely in high-leverage situations. But they rarely, if ever, contribute leverage to their teammates. Which brings me to the power of myth-making. Metrics that incorporate a relief pitcher’s leverage but ignore his ability to create leverage for others paint a skewed picture of how relief pitchers create value. Teams that hold their most valuable bullpen arms in reserve waiting for save chances may be winning more close games (although not as many as they may think), but the cost may well be staying closer in fewer games to begin with.
Colin Wyers is an author of Baseball Prospectus. Follow @cwyers
|
Colin, another kick-ass article.
I also think that Cashman & Co. have already come to the same conclusion, as they are now paying their closer the same amount as their best set up guy. Good job, Yankees!
Well, the Soriano decision wasn't Cashman's, but you are right.
Also, if you can't find a decent #3/4/5 starter, you best try and build the strongest, deepest bullpen you can.
The issue with the Yanks is ... did they already have the bullpen answers in house? Does Moneyball's "reliever fungibility" still exist?
I agree completely.
I suppose I should have said, "Steinbrenner Siblings" but I prefer the ring of "Cashman & Co" regardless of whether the decision originated in Tampa.
I suspect that fungibility of relievers does still exist, as much as it ever has. Given enough opportunities (ie sample size), if a guy can get batters out in the 7th, he can do it in the 9th.
And, just to expound on the point, the reverse is also true. If a guy in today's game is 'closing' in the ninth, then he damn well can come into the game in the 7th with the game on the line in the playoffs (note to Girardi). Get your best guy in to put out the fire.
Can we create and publicize a new LEV-based award (i.e. "Fireman" or "Rally-killer"), and publicize it? The guy who pitches in the highest LEV situations outside the 9th inning wins the award.
How can we see that LEV leaderboard with the sortable stats?