 14 comments have been left for this article.
 BP Comment Quick Links

|

|
December 20, 2010 Ahead in the CountA Pitch for Joe Blanton
From the ashes of the Tweet-pocalypse of rumors that culminated in Cliff Lee’s surprise five-year deal with the Phillies, there arose another batch of rumors about how the Phillies would make room for Lee’s salary. The Phillies are now committed to spend about $163 million in 2011 based on their current roster, which is $21 million more than they spent in 2010. The Phillies have made it known that they are trying to move salary to make this work, and it is no secret that they are trying to move Joe Blanton. Blanton is owed $17 million over the next two years, and his ERA in 2010 was an unspectacular 4.82. ESPN’s Buster Olney reports that multiple GMs have told him the Phillies would need to eat some salary on Blanton’s contract to trade him, implying that he is not worth that salary over the next two seasons. Although two years of a pitcher with an ERA of 4.82 is worth about $13 million combined, Blanton is almost certainly going to do much better than last year’s mark. In his first two seasons with the Phillies, Blanton has ERAs of 4.05 and 4.82, but his SIERAs have been 3.92 and 4.01. SIERA is a far superior representation of Blanton’s true talent level, because it only uses statistics that are generally consistent from year to year: strikeouts, walks, and ground-ball rates. Blanton’s high ERA this season came as a result of his .324 Batting Average on Balls in Play (BABIP), which is 24 points above the league average and 30 points above the Phillies’ team average; he had a 16.4 percent home runs per outfield fly ball rate (HR/OFB), which is 2.1 percent above the Phillies’ average, and 3.4 percent above the league average. Despite the fact that both statistics show that batters hit the ball harder against Blanton in 2010, neither of these statistics describe a skill that pitchers repeatedly struggle with. Pitchers are occasionally hit especially hard one year, but when there are no concurrent changes in strikeout rate, pitchers frequently reverse these trends the following year. The same should be expected from Blanton. Kentucky Joe may not have the reputation of an above-average pitcher, but he fits into a small group of hurlers who command the strike zone well enough to strike out an above average number of hitters over the last two years, while still striking out many more than 2.9 times as many hitters as they walk, and pitching 370 innings. Only 19 such pitchers have done at least as well as Blanton at these important statistics. In the table below, I have also included the current contract of the pitcher and his service time (so that pitchers with fewer than six years of service are not included in this analysis). Note that I have only focused on the portion of a pitcher’s contract covering free-agent seasons, because the other seasons’ salaries are not dictated by market conditions. For example, only two years and $29 million of Dan Haren’s four-year deal will occur after he has reached six years of service time.
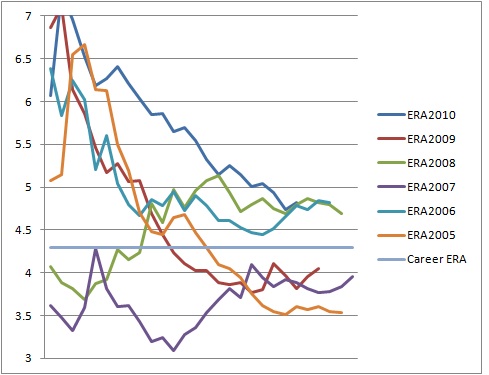
It is true that Blanton is probably the worst pitcher on this list, because it was designed to figure out who had outpitched him over the last two years, but he is undoubtedly being underrated by people who label him “an innings eater” or a fifth starter. Blanton is almost definitely one of the top 50 starters in the league, meaning that he would be the second-best starter for most teams. His salary represents the cost of a pitcher who is worth about 1.7 wins per year, which is roughly equal to a pitcher who pitches 180 innings with a 4.60 ERA. Blanton’s SIERA has hovered around 4.00 for the last two years, and he seems likely to land around this mark again. A pitcher with a 4.20 ERA over 180 innings is worth about $25 million over two years. A pitcher with a 4.00 ERA over 180 innings is worth at least $30 million over two years. Teams with an opening for a starter should not only be willing to take on the remaining $17 million of Blanton’s salary, but should be willing to part with a couple of names just outside of the league’s top 100 prospects, or one name near the league’s top 50-100 prospects. Instead, rumors suggest that the Phillies will eat salary and get no prospects in return. When Blanton was on the Athletics, he established a reputation as a contact pitcher. He struck out only 13.4 percent of American League hitters he faced, but since joining the National League, he has struck out 18.1 percent of hitters. This is not just a strength-of-opponents difference—pitchers do not regularly increase their strikeout rate this much upon switching leagues. Blanton has changed his skill level since joining the Phillies. This has seemingly gone unnoticed, particularly because he had unlucky BABIP and HR/FB numbers in 2010, which made his 2009 season look like a fluke. However, strikeout rate is one of the two statistics that pitchers are most likely to maintain from year to year (the other is ground-ball rate). Thus, Eric Seidman wrote about Joe Blanton going into the 2010 season, highlighting the fact that he was no longer just an innings eater and was now an above-average pitcher. Why does Blanton still have the same reputation? Why do even Phillies fans believe that he is not worth his contract? Part of the reason is that reputations stick. Blanton simply looks like an average Joe. He is heavy and often unshaven. He doesn’t look like an elite athlete. His appearance has not changed, and there is nothing obviously different about his repertoire on the mound either. The only things that have changed are that he has moved toward a two-seam fastball from a four-seam fastball, and he has increased usage of his slider at the expense of frequent curveballs. Neither is readily apparent to casual observers. In Seidman’s article last year, he discussed the topic with Russell A. Carleton, who explained that people categorize to keep track of large groups of names, and that Blanton’s improvement has not been noteworthy enough to change people’s categorization for him. As a result, he is grouped in with back-of-the-rotation starters. Furthermore, since he has only had one recent year (2009) since his transformation in which he has had a low ERA, the high mark in 2010 has served as confirmation bias to people who thought 2009 was a fluke. However, there is every reason to believe that the fluke will prove to be 2010, as a pitcher with control like Blanton has, who can now also miss bats, is unlikely to be a below average pitcher. In fact, Blanton’s second half of 2010 already showed the correction in his luck, as his ERA was only 3.48 after the All-Star break. The truth is that there is only half a season of poor performance from Blanton in recent years. This actually provides another clue about why he has been underrated: he is a second-half pitcher. In his career, Blanton’s ERA before the break is 4.63, while his second-half ERA is 3.90. Fans may prefer pitchers who improve as the season goes on, but they also become accustomed to checking a player’s numbers over the course of the season and expecting certain results. If a pitcher has a high ERA when they check, they become used to thinking about him that way. They may not consider that the ERA at the end of the season includes all of the innings that were pitched at the beginning of the season, and simply focus on the fact that a player usually has a high ERA when they look him up. The following chart shows Blanton’s ERA from his seventh start through the end of the season in his six full seasons in the major leagues. Notice the downward trend in his ERA that makes it appear that his numbers have been worse than they are.
Blanton has a career ERA of 4.30, even including his low strikeout years in Oakland, but for the majority of the seasons, his ERAs have been higher than this. If you were to check Blanton’s ERA after every start he has made over the last six seasons, his average ERA would be 4.73, and even if you only started checking with his seventh start of the season, his average ERA across each look-up would 4.67. This is almost half a run larger than his actual average ERA. In other words, most of the times that fans check on Blanton, his current ERA is below average even though he is an above-average pitcher. This may not be as large an issue for other pitchers who have not improved over time, but it has made it particularly challenging for Blanton to overcome his reputation. The Phillies may need to move salary to meet their budget for 2011, but selling Blanton for pennies on the dollar may not the best use of resources. Unfortunately, although Blanton would be among the top four starters for maybe 25 other teams, he is clearly the fifth-best starter on the Phillies, and barring an injury lasting into October to one of their four aces, he will not start a post-season game for the Phillies. Thus, he has more value to nearly any other team. Under normal circumstances, my suggestion for the Phillies would be to wait until Blanton has demonstrated his true value around the All-Star break to trade him, but if he continues to be a second-half pitcher, he will only justify his underrated status to skeptics in late July. Half-season splits are not a particularly persistent statistic, but that does not mean that they are not likely to persist for certain pitchers. The Phillies could try to move another salary, like Raul Ibanez’s, but they may struggle to fill his spot in left field with payroll restrictions, and downgrading themselves for a likely playoff run at the expense of maintaining their fifth-best. Blanton is not owed a penny until the season starts, so the best solution for the Phillies now is to bide their time this winter. The club can only hope teams take the time to notice that Kentucky Joe is going to eat innings more efficiently than the rest of the league expects.
Matt Swartz is an author of Baseball Prospectus.
|
How helpful is it to show a chart in which Blanton finishes last (or very close to it) in every category. I think it would be more illustrative to show other pitchers within a reasonable range of his peripherals. Let's say 350-400 IP, K% between 17-20%, SO/BB between 2.75-3.25 and service time over 4 years. Who would be in Joe Blanton's cohort then?
That's a very specific cohort. It includes Joe Blanton and Johan Santana.
Take away the service time minimum and you include Jason Hammel. Replace the IP of 350-400 limit with a 300-450 and you get Chris Carpenter.