
 27 comments have been left for this article.
 BP Comment Quick Links

|

|
December 15, 2010 Ahead in the CountGround-ballers: Better than You Think
There are two more important reasons why Skill-Interactive Earned Run Average's (SIERA) is so successful at predicting the following year's ERA. First, most other Defense-Independent Pitching Statistics, like FIP and xFIP, assume that pitchers have no control over their Batting Average on Ball in Play (BABIP), but we know that they do have some control. I have shown before that pitchers with high strikeout totals and low ground-ball rates tend to allow fewer hits per ball in play, and thus lower BABIPs. Of course, BABIP is subject to so much luck that it is nearly impossible to discern a pitcher's true ability to prevent hits on balls in play from his historical BABIP. That is why last year's FIP is much better at predicting this year's ERA than last year's ERA is. It strips ERA of BABIP (and sequencing) altogether and assumes league-average BABIP for all pitchers and random sequencing. Another reason that SIERA is great at predicting ERA is that it accounts for the run-prevention effect of ground balls - particularly, it controls for the fact that the effect is nonlinear. Not only do more ground balls lead to fewer runs allowed, but the difference in ERA between pitchers who generate 40 to 50 percent ground balls is smaller than the difference in ERA between pitchers who generate 50 to 60 percent ground balls. That is why there is a negative coefficient on the squared ground-ball rate term in SIERA. At the time, Eric and I believed the fewer runs allowed was just an artifact of ground-ball double plays erasing singles, but the effect is simply too large for that explanation. The interaction terms actually add only a small (but useful) effect at predicting ERA, but the ground-ball rate is really the difference between SIERA and its predecessors. Additionally, the implied positive ground-ball squared coefficient in QERA is actually that statistic's biggest flaw. In this article, I will look in more detail at ground-ball pitchers and why they are so good at preventing runs. The first thing that I checked was whether pitchers with high ground-ball rates allowed lower hit rates on ground balls. Teams with good infield defense may target ground-ball pitchers, so to correct for this, I looked at the batting average allowed on ground balls for each pitcher relative to their team. Just to be assured that batted-ball classification did not get in the way (lest Colin Wyers show up at my door with a baseball bat), I looked at pitchers' ground-ball rates relative to their team (though the effect was clear either way). For the 3,297 pitchers who allowed at least 100 balls in play in a season between 2003 and 2010, the correlation between their net ground-ball rate and their net ground-ball batting average was -.185. I was concerned that relievers facing same-handed hitters might be creating a false correlation, so I looked at only pitchers with 300 balls in play in a season and found an even higher correlation: -.241. Pitchers who allow more ground balls allow fewer ground-ball hits. The following table shows all pitchers who have had consecutive seasons of a 60 percent ground-ball rate (with at least 300 balls in play) since 2003:
Each of these guys has a career BABIP on ground balls that is at least 12 points below their teams' ground-ball BABIP. This is not a coincidence. They don't just induce contact with downward trajectories - they induce ground balls that are easier to field. This is also true for slugging average on ground balls in play. There is a similar negative correlation for this group.
Do ground-ball pitchers induce weak contact on all balls in play? No. The reverse seems to be true for fly balls. Looking at outfield fly balls only, and excluding home runs, ground-ball pitchers have a distinctly higher BABIP and slugging average on balls in play.
However, these ground-ballers do not exhibit any tendencies toward line-drive BABIPs and infield pop-up BABIPs that are different than other pitchers. There is almost zero correlation year to year for BABIP on line drives or pop-ups for any pitchers.
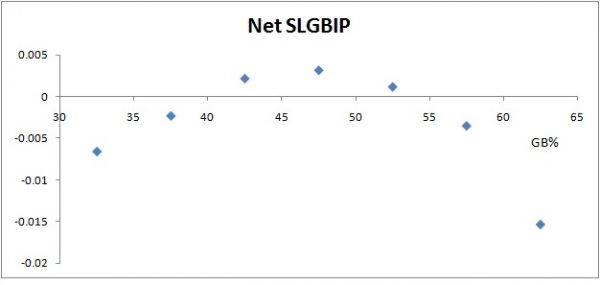
The .025 correlation year to year on line-drive BABIP is particularly surprising because it is at odds with previous research. Six years ago, Mitchel Lichtman found that line-drive BABIP was persistent for pitchers, but look at the line-drive BABIP net of team line-drive BABIP and this unravels. This is a mixture of team defense adjustment and official scorer adjustment, but it un-teaches something important about pitcher BABIP that many of us thought we knew. Contrast the randomness of line-drive BABIP and pop-up BABIP with ground-ball and fly-ball BABIPs, which have a .188 and .152 year-to-year correlations respectively, net of team. Overall, ground-ball pitchers allow higher BABIPs, but not higher slugging average on balls in play. This is primarily because ground balls are hits more often than fly balls, but the slugging on the two types of batted balls is similar. The correlation between ground-ball rate and overall BABIP and SLGBIP is shown below, with following year BABIP and following year SLGBIP alongside it:
However, correlation is a rough statistic that does not reveal subtleties or curvatures, so it misses the truth of what is going on. Non-extreme ground-ball pitchers (those with 45-60 percent of balls in play as a ground ball) allow the highest BABIPs, but pitchers with ground-ball rates over 60 percent actually allows average BABIPs. To adjust for the fact that some pitchers allowed more ground balls than others, I weighted the BABIP of each pitcher by the actual number of ground balls allowed.
The following graph of the average net BABIP in each group by ground-ball rate is even clearer:
While the lowest BABIPs belong to pitchers who allow fewer than 40 percent ground balls (these pitchers often have high infield pop-up rates), the pitchers with the highest ground-ball rates had lower BABIPs than pitchers with just slightly above-average ground-ball rates. Moving on to look at slugging average on balls in play, we see that the non-correlation of ground-ball rate and slugging average on balls in play does not mean no relationship exists. In fact, pitchers with very low and very high ground-ball rates had the lowest slugging average on balls in play, while the highest slugging average on balls in play belongs to pitchers with average ground-ball rates.
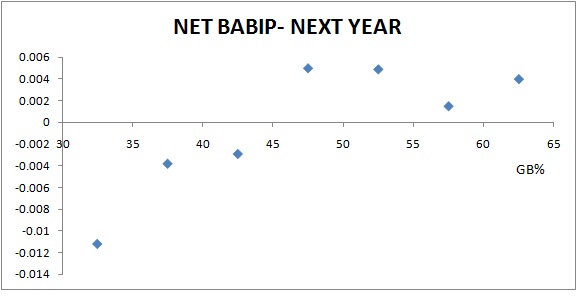
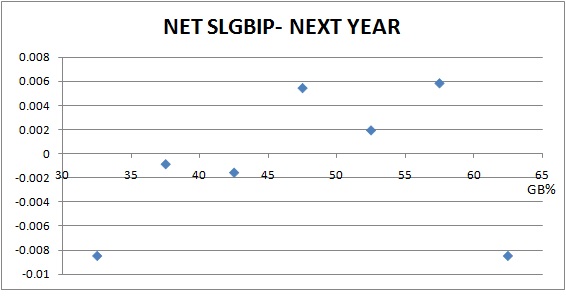
Both of these statistics work well with a quadratic fit with respect to ground-ball rate in a regression analysis. The BABIP (with errors included) of the 3,297 pitchers with at least 100 balls in play is best predicted by the following formula: Net BABIP (with ROE) = -.002 + .136*(net GB%) - .401*(net GB%)^2 The p-statistic on both net ground-ball rate and its square was less than .01. The SLGBIP (with errors included as singles) of the same 3,297 pitchers with at least 100 balls in play is best predicted by the following formula: Net SLGBIP (with ROE) = -.003 + .097*(net GB%) - .611*(net GB%)^2 Again, the p-statistic is less than .01 for both net ground-ball rate and its square. The best way to adjust for this would be to also adjust for the strikeout and walk rates, in which case we would get the following equations for BABIP and SLGBIP: Net BABIP (with ROE) = .010 + .121*(net GB%) - .383*(net GB%)^2 - .082*(K%) + .033*(BB%) Net SLGBIP (with ROE) = .017 + .072*(netGB%) - .580*(GB%) - .150*(K%) + .065*(BB%) In both equations, the net ground-ball rate and its square had p-statistics that were less than .01, as was the strikeout rate coefficient. The walk rate coefficient had p=.032 for SLGBIP and p=.123 for BABIP, the latter of which is not statistically significant, but is still suggests an effect. Given this curvature, it only makes sense that the inclusion of the ground-ball squared term did so much to help SIERA to fit the data. The shape is less obvious when looking at the following year's BABIP and SLGBIP because ground-ball rates jump around, but we still see a generally similar effect in the two tables and graphs of these statistics below:
This data shows that ground-ball pitchers have a hidden value and that modeling BABIP indirectly as we did with SIERA, rather than assuming pitchers do not control it, helps improve the prediction of ERA. Statistics like xFIP have the benefit that the run value of defense-independent statistics (strikeouts, walks, and home runs) are done precisely with linear weights, but xFIP does not take into account that BABIP is lower for fly-ball pitchers. However, SIERA shows that extreme ground-ball pitchers also have a skill at preventing BABIP themselves. Next time, I will look in more detail at another statistic that pitchers have little control over - the rate of home runs per fly ball. This statistic has a low year-to-year correlation, lower than BABIP does (.07 for HR/FB versus .13 for BABIP, both net of team rates) - but SIERA still gives us some help at picking up some of this effect.
Matt Swartz is an author of Baseball Prospectus.
|
|||||||||||||||||||||||||||||||||||||||||||||||||||||||||||||||||||||||||||||||||||||||||||||||||||||||||||||||||||||||||||||||||||||||||||||||||||||||||||||||||||||||||||||||||||||||||||||||||||||||||||||||||||||||||||||||||||||||||||||||||||||||||||||||||||||||
Lost you in the middle there. If there is a considerable benefit to being a high GB% pitcher that xFIP doesn't capture, wouldn't it take fewer tables to show it?
I don't doubt that your research is correct and there is an effect, but I'm having a hard time grasping the magnitude of this effect. Can you please provide some examples, on a scale like runs per game?
Yes, there is a benefit to being a high GB% pitcher than xFIP doesn't calculate. xFIP assumes BABIP skill is equal for all pitchers so it misses pitcher differences in that skill. xFIP's strength is that it more precisely knows the direct effect on runs of HR, BB, and K than SIERA can tell its own. The tables aren't a takedown of xFIP. They're just a way of highlighting the effect of ground balls that I have found.
The standard deviation of pitcher BABIP skill is about .007, meaning that it's probably about 0.15-0.20 runs per nine innings for the average pitcher. SIERA picks up on this skill pretty well-- and specifically does so because it has a GB^2 term in the equation. The point of the article is to explain why that term came up as it did, and how helpful it is to understanding pitching.