
 30 comments have been left for this article.
 BP Comment Quick Links

|

|
November 3, 2010 Manufactured RunsReplacing ReplacementThis is something of a culmination of work I’ve been doing over the past few months—taking a menagerie of stats available here at Baseball Prospectus and merging them together under the heading of “Wins Above Replacement Level.” We’ve had WARP for quite a while—and its close sibling, VORP, as well—but it has been rather distinct from the rest of our offerings. That’s coming to an end. We will, of course, still carry a number of baseball statistics not concerned with directly measuring a player’s value—there are a number of stats both descriptive and predictive that aren’t going away. But in terms of value measures, we’re going to consolidate down to one view. And that view will not be identical to similar measures of wins above replacement found at other websites. It will obviously bear some similarities (they all should agree more often than they disagree, I would think) but it’s not the goal of the enterprise. A while back, Rob Neyer quoted a letter that sums up a growing point of view: Instead of competing on WAR, Tango, Forman, BP and anyone else relevant should try to come to some consensus. Maybe you can serve as the summit leader? Otherwise, the sabermetric viewpoint will drown in its own contradictions. Let me tell you why I disagree—and let’s start off with the definition of sabermetrics proffered by Bill James, who after all coined the word to start with: "the search for objective knowledge about baseball." I think you can restate that definition simply as “baseball science,” or the study of baseball using the scientific method. And what I’ve been coming to grips with is how little of the field of sabermetric endeavor that definition covers (not all of what follows is necessarily going to be science, although it is definitely informed by what I would term a scientific study of baseball). Once you know things, you still need to interpret them—facts in isolation do not necessarily carry meaning. So in coming to a reckoning of a player’s value, science is only going to take us so far. And two reasonable people can disagree over the assumptions one starts out from. I’ve talked before about why I find the systemic approach valuable—in short, I find it more useful to start off with assumptions and move to conclusions than vice versa. But that doesn’t mean our assumptions are perfect. I think it’s tempting for some people to make the perfect the enemy of the good—what cannot be done perfectly is dismissed outright. And when it comes to replacement level metrics, where that’s most tempting is in the definition of replacement itself. Average JoesThe case against replacement level, I think, can be summed up like so:
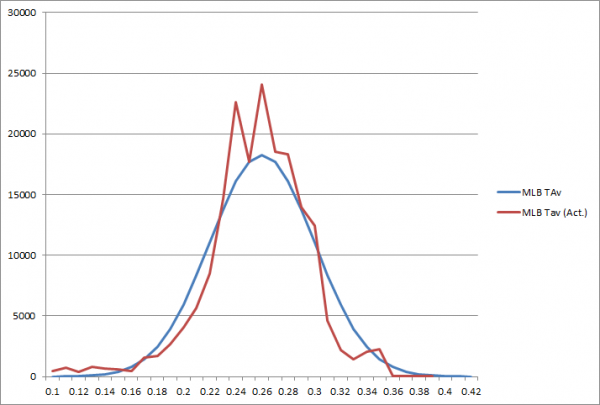
The first two of those I feel are correct but don’t detract from the usage of replacement level—because the third point is clearly wrong. The most frequently cited alternative to replacement level is average. On the first point, it fails to improve upon replacement level—an “average” baseball player does not exist any more or less than a replacement player. It’s an abstraction, designed to help us visualize a player’s value relative to something else. It does improve on the second point, as “average” (if we take that to signify the arithmetic mean) has a consistent definition; in other words, everyone understands it to mean the same thing. There is one question that average is deeply unsuited to answer, except circularly—what is the value of an average ballplayer? What it will tell you is simply this—the same as every other average ballplayer. Often this will serve, but just as often, it really won’t. The biggest point of breakage is in determining the value of playing time. Again—average is equal to average, be it in 150 plate appearances or 650 plate appearances. But realistically, we know that the player who manages to sustain an average level of performance is more valuable than the player who does so for only 150 plate appearances. It is possible that the 150 PA player could, given an additional 500 PA (assuming he was capable of playing an additional 500 PA at all), put up the same level of performance. But that’s irrelevant to measuring what has happened. Or take the example of a player who has produced 20 runs below average. That is, again, very different if it occurs in 150 PA or 650 PA—roughly the difference between a .150 TAv and a .230 TAv. And while above we extolled the virtues of the average player with more playing time, nobody would find a “true” .150 TAv hitter (that is to say, one who will hit .150 TAv regardless of playing time, not a hitter who hits .150 TAv over a cold streak) more valuable the more he plays—there’s an opportunity cost to deploying that hitter, in that he’s taking at-bats from a player who can do more to help his team. He’s actually hurting his team more the more he plays. And this is why we find replacement level useful—we are trying to find the point at which a player starts to contribute to his team by playing more, as opposed to detracting from his team. And this is something that is difficult to measure, as the critics of replacement level say—but the difficulty doesn’t make it any less important for us to know. Baseball fans have always known intuitively that there is such a point, of course—they even have a name for it, the Mendoza line. But it may be helpful to know why it exists. Consider the distribution of MLB batting performance, by TAv, in 2010 (with an idealized normal distribution fit to the data, for illustration purposes):
What you see is the majority of plate appearances at the average of .260, with outliers becoming less common the further you get from the average. The normal distribution seems to be a very good (although not perfect) approximation for the data. That is, again, in terms of plate appearances. If you consider players, on the other hand, it becomes a very different story. Looking at the area of the graph between 1 and 4 standard deviations above the average, we see that those plate appearances came from 78 players. Looking at 1 to 4 SDs below the average, we instead see 305 players. What the graph seems to suggest, at first blush, is that below-average players are just as rare as above-average players. But this simply isn’t the case—below-average players are much, much more common than above-average players (and this isn’t even considering the number of those players available in a club’s minor-league system). What’s limited is the number of opportunities for below-average players—baseball teams have a limited amount of playing time available to them, and they strive mightily to make sure the lion’s share of that playing time goes to their better players. The break-even point (that is, our platonic “ideal” replacement level) is the point where the number of available players at that level of talent (note—at that level of talent) exceeds the available playing time. Where this gets tricky is that there are transactional costs to acquiring baseball players—making trades, adding players to the 40-man roster, etc.—that impose a limit on how flexible teams can be with their replacements. In other words, the supply of talent isn’t totally liquid. So the practical replacement level may be a bit lower than our platonic “ideal” replacement level—which is fine, as typically we define replacement level as it exists in practice, not in terms of the distribution of talent. Defining replacement levelSo in order to come up with a baseline of what a replacement player is, we need to define a population of replacement players and take the average of that (This is important to note—50% of our replacements will be above our baseline, and 50% of them will be below it. So in practice, we fully expect to see submarginal performance—that is, some level of performance below replacement). I had two main objectives in picking my replacement-level pool. On one hand, I wanted to make sure I was picking my pool of replacements independently of how well they performed—using a player’s observed level of performance to set replacement level runs the risk of leading yourself around by the nose, leading you to a lower replacement level than you really should find. On the other hand, I wanted to avoid something like Nate Silver’s study of freely available talent, which relies on salary data that goes back only to the mid '80s. And I wanted to ensure that I had a sizable pool of replacements at which to look. What I came upon was the notion of looking at a team’s opening day roster, and calling anyone who replaces a player on it, well, a replacement. Not finding a ready source of opening day rosters, I did my best to reconstruct estimates of every team’s opening day roster from the play-by-play accounts provided by Retrosheet. Now, this may differ in theory from other definitions of replacement—these players obviously aren’t “freely-available” in all cases, in that some of them are either players returning from injury or top prospects. In practice, this matters very little. What it does give us is a far more sensitive indicator of replacement level than we’ve had previously, allowing us to track changes in replacement level over time. Looking at replacement-level TAv+, by year:
These are not smooth values, so you can see the magnitude of the noise in the measurement (the values will be smoothed out when applied to what you see on the site). But you can see the replacement level shifting gradually over time. What this means is that any particular replacement metric’s baseline is set by the period of study; by taking a closer look, we can use a different replacement level for the '50s than the aughts, better suiting our metric to a wide range of time frames. Combined with our positional adjustments, runs above average derived from linear weights, and park factors, we now have the elements necessary to compute a new VORP, one which meshes with TAv, our preferred rate stat for measuring offense. We can go further and combine that with our estimates of a player’s contributions on defense and baserunning (EqBRR and its component stats will be undergoing slight changes, mostly so that they draw upon the same run expectancy tables used to generate our offensive stats) to come up with something like what Nate used to call SuperVORP. Running those figures through Pythagenpat converts runs to wins, and we have WARP. What’s nextReaders rightly want to know when they’ll get to see the finished product. We are currently undergoing two big projects—obviously we’re busy at work putting together the latest edition of our annual, but we’re also busy behind the scenes rebuilding the website (well, I say we, but my involvement entirely consists of looking at what others are doing and saying, “Wow, that looks great”). The overhaul of our statistics is going hand-in-hand with those two efforts, and you should see the new stats in concert with the completion of those two projects. You probably also want to know what we’re doing with WARP for pitching. We’ll get into that next week.
Colin Wyers is an author of Baseball Prospectus. Follow @cwyers
|
I understand the concept or WARP, but that doesn't mean I have to like it. WARP compares a player to a hypothetical other option, but that isn't how we generally compare players. We'll usually look for someone similar to compare said player to.
I would prefer to compare players to the average player. I understand a team cannot simply replace someone with an average player, but the 2003 Tigers proved you can't even replace a player with a replacement level player.
Of particular frustration is HoF discussions using WARP. In theory an average player who played in the Major leagues an exceptionally long time could put up HoF level WARP totals without ever being one of the best players at his position.
I don't really understand your objection here, Scott:
"WARP compares a player to a hypothetical other option, but that isn't how we generally compare players."
So how does this make average better? When a player has to be replaced, a team doesn't say "What do we have relative to the average?" The team says "What do we have?" An estimated replacement level does a better job of simulating real roster-staffing issues than an estimated average level. Colin refers to this specifically in this piece. So how again is using average better?
To your other point, where do you find those HoF discussions using WARP, other than at BP? See, at BP, Jay Jaffe is smart enough to understand that raw WARP totals alone are not a good way to determine who is and isn't a "Hof-quality" player. For this purpose Jay has devised the JAWS system, which works in a couple of different measures of peak value.
Where are they having HoF discussions using raw WARP totals? If you find these discussions, you should probably chime in regarding peak value, and then maybe those discussions will get better. None of this has anything to do with WARP's limitations, so could you be more specific as to what those are?
Average player is just as hypothetical as replacement player. Using replacement player as your baseline allows you to try to account for the fact that playing time is not uniformly distributed between above average players and below average players.
And how is an average player accumulating WARP any different from an average player accumulating hits or RBIs or Wins or whatever? Anybody using counting stats solely with no discussion of rate stats/peak performance is not having a very useful HoF discussion.