 8 comments have been left for this article.
 BP Comment Quick Links

|

|
October 25, 2010 BP UnfilteredMaking sense of ratings
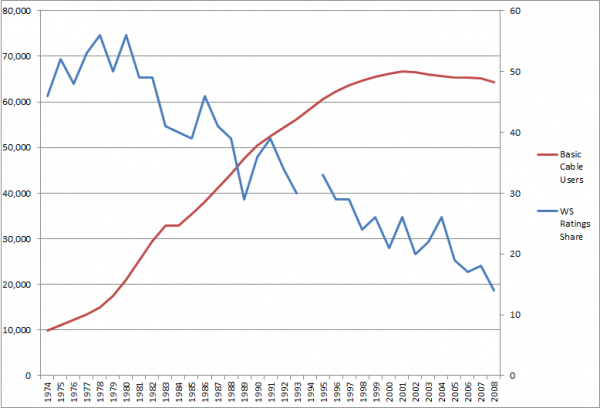
People who like to talk about baseball's impending doom (which as far as I can tell, has been "impending" since the end of the deadball era) have a new (old) talking point - baseball's ratings in the playoffs. This is done largely by focusing on one playoff game that underperformed Monday Night Football. And, yes, it happened. But it's only one data point - and there are a lot of other data points that say ratings for this year's playoffs are on the upswing, compared to when MLB started airing part of the playoffs on cable. Now, in a larger historical context, ratings for playoff baseball have been dropping pretty steadily over time. The simplest explanation for this is change in the overall broadcast landscape over time. Let's look at the World Series ratings over time, compared with US Census figures on the number of basic cable subscribers:
The red line represents cable TV subscribers, using the axis on the left. (Cable households are expressed in thousands, following the convention the Census uses - 10,000 on the chart really means 10 million.) The blue line is the average ratings share, as measured by Nielsen, for the World Series that year, using the axis on the right. Note the gap in '94, due to the strike. I do want to note that Nielsen does not cover Canada, and so is probably understating the relative viewership of the '92 and '93 World Series, which featured the Toronto Blue Jays. 2009 is not included, due to the lack of Census data. What you can see is a pretty steady rise in the number of people who have at least basic cable. (You do see a downtick in cable users over time starting around 2000, as you see the rise of alternatives to cable.) And you see a corresponding decline in World Series viewership. Baseball is being buffeted by the same forces that pretty much all programming is - there are a lot more choices for people these days, and so any one program has difficulty attracting the same number of eyeballs as it would have a decade or two ago. Outside of the broader historic trends, there are two specific issues to look at. The first is the recession. This should likely play into MLB's favor, as sitting at home and watching TV is a relatively cheap form of entertainment. (This could explain the rise we've already seen in the Division Series and Championship Series ratings.) The other question is about the size of the markets involved. Using Nate Silver's model of team broadcast markets, I came up with the average market size for every World Series matchup since 2000:
This is a series that lacks an obvious top market like New York or Los Angeles, but lacks a really small market as well. The 2009 series, featuring a matchup of two of the biggest markets, was a aberration - ratings this year ought to see a fall-off from last year, even given the boost from the recession. There's no reason the series couldn't put up numbers like the Rays-Phillies or Cardinals-Tigers did, though.
Colin Wyers is an author of Baseball Prospectus. Follow @cwyers
|
Is the Fox cable battle accounted for in the ratings?
No. It accounts for about 3 million households, IIRC - it's probably not a big impact, especially without New York or Philadelphia in the World Series.