 3 comments have been left for this article.
 BP Comment Quick Links

|

|
March 14, 2010 Ahead in the CountFirst and Second Plate Appearances
It is well known that hitters do better against a starter the more times they face him in a game. In 2009, pitchers limited hitters to a .256/.322/.405 line the first time through the lineup, while the hitters were able to muster a .269/.333/.433 line the second time they faced the starter, and a .282/.346/.460 line the third time they faced the starter. This makes some intuitive sense, because pitchers do tire over the course of the game and also because the hitter has a better shot of hitting pitches he has seen already. The second reason interested me, because this is something quite different at the major-league level. When kids in high school face a pitcher, they typically have never watched him pitch before, and often do not find out if he throws a curveball or changeup until he actually throws one. Major leaguers have advance scouts to give them all this information. In recent decades, they have been able to view tape of a pitcher in advance of facing him and the videos are even more accessible in the digital age. As technology has improved, I wondered if the disadvantage of hitters during their first plate appearance got smaller. It’s difficult to separate the effect of the pitcher tiring from the effect of the hitter learning what a pitcher throws, but it’s important to know the difference. For instance, some have advocated that pitchers should have shorter, but more frequent appearances because of this decline over the course of the game. Knowing how much of this decline is due to the element of surprise can shine some light on the relevance of this strategy. Making an attempt to discover the changes in this effect over time can also demonstrate one potential area where technology can change how the game is played. So I decided to only look at the first two plate appearances that a hitter gets against a starting pitcher, since I figured that the pitcher would probably not be tired in most cases and we could isolate some of the effect of seeing the pitcher. Then I checked aggregate plate appearances in the league by each set of five years from 1955-2009, and compared how hitters did overall in their first and second plate appearance against a pitcher.
            First PA       Second PA         Difference
Timeframe  AVG/ OBP/ SLG   AVG/ OBP/ SLG   dAVG/dOBP/dSLG
1955-59   .242/.314/.364  .261/.325/.403   .019/.011/.039
1960-64   .239/.307/.358  .255/.315/.392   .017/.009/.034
1965-69   .229/.296/.336  .246/.306/.369   .017/.010/.033
1970-74   .240/.310/.346  .253/.315/.374   .013/.005/.027
1975-79   .251/.319/.366  .262/.322/.392   .011/.003/.026
1980-84   .253/.317/.370  .263/.321/.393   .010/.004/.022
1985-89   .248/.314/.373  .261/.322/.403   .013/.008/.030
1990-94   .253/.319/.379  .264/.326/.402   .011/.007/.023
1995-99   .260/.329/.405  .273/.337/.437   .013/.007/.031
2000-04   .258/.325/.412  .271/.335/.440   .014/.010/.028
2005-09   .260/.324/.411  .271/.334/.435   .012/.010/.024
It is helpful to look at this graphically:
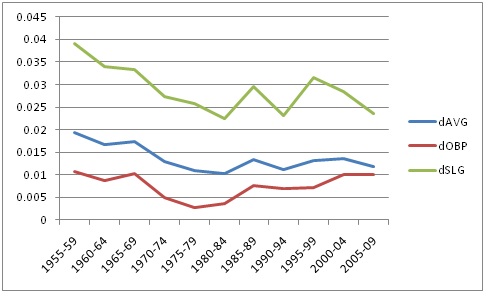 Looking at this, we see that there is certainly some evidence of slugging decreasing over time, but the effects of average and on-base percentage over time are still somewhat ambiguous. However, the slash stats of AVG/OBP/SLG are really just summary statistics, representing changes in the frequency of sets of events rather than frequency of specific events. Therefore, I decided to actually study what is happening differently in each at-bat, so I looked at four statistics: walks per plate appearance, strikeouts per plate appearance, home runs per plate appearance, and batting average on contact. This helps get to the heart of the issue. Starting with walks and strikeouts, we can start to see what the real change between plate appearances is:
           First PA  Second PA    Difference
Timeframe  BB%/SO%    BB%/SO%     dBB%/dSO%
1955-59    9.1/15.1   8.3/12.0    -0.8/-3.1
1960-64    8.5/17.1   7.7/13.9    -0.8/-3.1
1965-69    8.1/18.6   7.5/15.2    -0.6/-3.3
1970-74    8.8/16.6   8.0/13.8    -0.9/-2.8
1975-79    8.7/14.6   7.8/12.2    -0.9/-2.5
1980-84    8.3/14.8   7.6/12.4    -0.7/-2.4
1985-89    8.4/16.4   7.9/13.8    -0.5/-2.6
1990-94    8.4/16.3   8.0/14.1    -0.4/-2.2
1995-99    8.7/17.8   8.2/15.5    -0.5/-2.3
2000-04    8.3/18.0   8.1/15.6    -0.2/-2.4
2005-09    7.9/18.2   7.9/15.9    -0.0/-2.3
Graphically, the changes are even clearer:
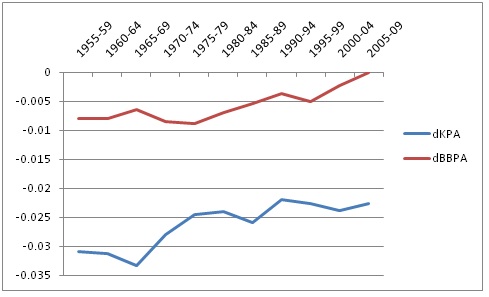 It's immediately noticeable that both strikeouts and walks occur more often the first time a hitter comes up, while the hitter makes contact more the second time up. This is probably because hitters are taking more pitches the first time up, leading to more walks, but also getting behind in the count more. They also seem to be doing this less over time, and my suspicion is that technology changes are driving this. Hitters know what to expect in advance, and take fewer pitches. The question is whether taking fewer pitcher helps them the second time up. Thus, we look at the change in home runs per plate appearance and batting average on contact (which Colin Wyers dubbed BaCON, the number that everything's better with), to see if they are hitting the ball harder the second time around.
           First PA    Second PA   Difference
Timeframe  HR%/BaCON   HR%/BaCON   dHR%/dBaCON
1955-59    2.06/.289   2.53/.299   0.47/.010
1960-64    2.03/.292   2.47/.299   0.44/.007
1965-69    1.76/.287   2.14/.294   0.39/.008
1970-74    1.72/.292   2.14/.296   0.33/.004
1975-79    1.73/.298   2.08/.300   0.35/.000
1980-84    1.80/.301   2.13/.303   0.32/.002
1985-89    2.07/.301   2.44/.306   0.36/.005
1990-94    2.01/.306   2.27/.310   0.26/.004
1995-99    2.52/.322   2.92/.327   0.41/.005
2000-04    2.70/.320   3.04/.325   0.34/.005
2005-09    2.64/.323   2.85/.327   0.21/.004
Looking at this graphically, it’s pretty clear that players do hit the ball harder the second time, but the increase from the first to second plate appearance has declined over time.
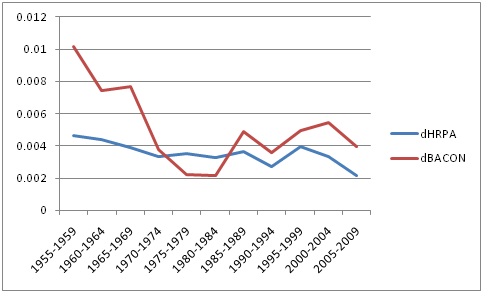 The decrease in strikeouts and walks the second time up and the increase in home runs the second time were all statistically significant, but the decline in batting average on contact was not overall on most tests, depending on how I spliced the data. Overall, there does seem to be a pretty clear change taking place over time. Hitters take more pitches the first time up, while they hit the ball harder the second time up after doing so. My best guess about the reason is that as technology improves, players are better able to see pitchers in advance in more detail and get more information so the pitcher is able to surprise the hitter less the first time around. It looks like some of the steepest changes occurred during the 1970s and 1980s, so there may be something other than video technology going on, as teams were not regularly on cable television until the very early 1980s, and the VCR did not become widely used until the early 1980s, either. Back then, Tony Gwynn was known for carrying a VCR and video library with him on road trips of all his plate appearances. This was ground-breaking in the mid-'80s, when few players were studying video. Nowadays, players have video iPods and other devices with them to review a pitcher before facing him. The difference in walks between the first two times up has disappeared almost entirely. I suspect that some of the early change before the introduction of the video technology may have been advance scouting, which became easier and cheaper to do as travel became easier as well. Real changes occur in the way that baseball is played over time, and they change interesting facts like this. While it’s no doubt interesting that pitchers dominate hitters more the first time up, it is even more interesting to consider why. Changes over time are clues, and are ways for teams to potentially understand the game better and how to stay ahead of the curve.
Matt Swartz is an author of Baseball Prospectus.
|
Think this reduces the effectiveness of:
A) relievers?
B) something like Ken's SOMA plan?
Hmm..definitely interesting questions. I think it definitely decreases the benefit of the SOMA plan, especially since the effect is still getting smaller over time. I would think the technology aspect of being able to see a reliever in advance certainly would lower their effectiveness too. At the same time, the specialization of relievers is probably making them more effective as technology improves too-- teams can learn what type of pitches hitters struggle with more as they have better access to technology (pitch F/X, etc.). They can't teach a right-handed starter to just randomly learn to throw a slider with his left hand against Ryan Howard, but they can certainly bring in a lefty slider-thrower.